Create Queries
You can build several queries within the same worksheet. Query results are returned in a tabular format, starting in the cell that is selected when you create that query. Before creating a new query, ensure that you have selected the cell where you the results to be sent. See notes later in this topic for using cut and paste within Excel to move the query result to a new location.
Queries are saved in the current workbook.
Be sure to leave space for the full query result. Every selected tag and every calculation you make will require a column(*). If you are querying for a day's data with hourly summaries, you will need 24 rows for the data and one for the title. The first time a query runs, it will use every cell that it needs, whether empty or not.
On subsequent queries, cells that contain other information will be moved as needed in order to accommodate a block that changes in size. Formulas within those cells may not adjust correctly. You are advised to find the space that will be needed by your query results and leave room.
(*) Or row rather than column if you choose to flip the result. These notes will refer to the default orientation where tags are listed across the columns and data fills the rows below each tag name.
If you need a presentation-quality report, you might choose to send the query results to a second sheet in the workbook. The first sheet can be used for the presentation layout, with links to data that is sent to the second sheet.
A query is built of several parts: Tag Selection, Time Ranges, Query Attributes (including calculations) and a choice of More Settings.
For each part, there are many options. Therefore, these notes do not attempt to provide a single set of steps to build a query. Instead, each part is discussed on its own, the options presented, and instructions or notes are provided to help you use each option.
Ensure that you have selected an appropriate target cell in the worksheet before beginning. See the notes at the beginning of this topic. The initial stages of query building can be presented as a series of steps:
There is no "show children" option when browsing tags. Only one level at a time is shown.
- Begin the process of building a query by selecting the History tool in the VTScada toolbar to open the Tag History Queries panel.
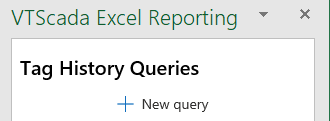
The Tag History Queries panel with no saved queries
- Select the New Query tool.
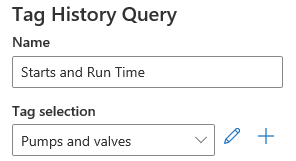
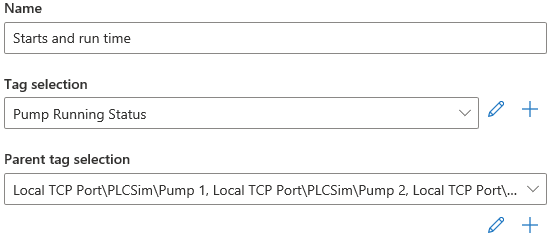
The Tag History Query panel opens. (see following image)- Give the query a name that describes its purpose.
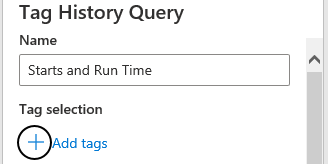
Creating a query named "Starts and Run Time"
- Select the Add tags tool (circled in previous figure).
The VTScada Tag Browser opens:
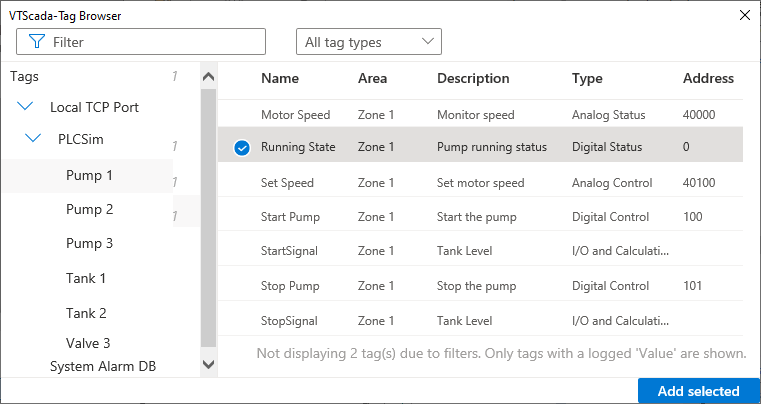
The Excel Reporting Tag Browser showing one tag selected for addition to the set.
Note the two filters. The name filter (left) assumes wildcards. In the example shown, "Start" would find both "Start Pump" and "StartSignal". Do not add your own wildcard characters.
The type filter (right) will limit the view by group such as "Analogs", "Digitals" etc. Only types that are present in your application are available in the filter.
Filters apply only to the current level in the tag hierarchy; there is no "Show Children" option.
The digit beside each parent tag in the left window indicates the number of tags selected below that parent tag.
- Use the Add selected tool to finish creating the tag selection.
You can select several tags at once. There is no need to use "Add selected" until you have finished selecting tags. Selected tags will remain selected as you navigate through the tag hierarchy.
After using the Add selected tool, you will be given a chance to rename the selection set, and to review and edit the list (adding more tags if you clicked "Add selected" before you were finished.)
- Select "Save" when you have finished selecting tags.
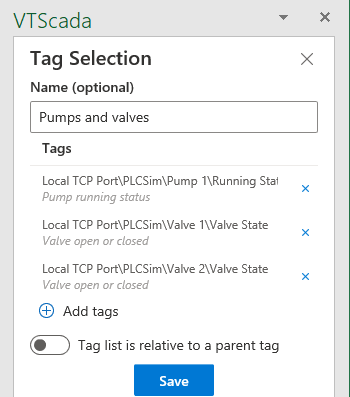
Saving your tag selection
The option, "Tag list is relative to a parent tag" is described later in this topic.The default name for a tag selection set is the list of tags within the set. You may find it easier to manage sets if you provide your own descriptive names instead.
You are returned to the Tag History Query panel.
A named selection set.
You can modify the tag selection at any time. (The edit tool is circled.) You can also switch to another saved tag selection.
But, only one named tag selection can be used in any query.Variation: Tag list is relative to a parent tag
If your tags were built according to the advice in Plan your tag structures carefully, you will have a number of pumps, stations, generators, etc. that each contain a set of tags with the same names. Rather than select the same tags in every instance, you can select the tags from one instance, then create a list of stations or equipment instances containing those tags.
- Start by selecting the tags in one instance using the instructions from the preceding section. In the following example, one tag is chosen from Pump 1: Running State.
- Use the "Add selected" tool to return to the Tag History Query panel.
- Select the option, Tag list is relative to a parent tag.
- Select the closest parent to the set of tags. In this example, that is the Pump 1 context.
- Save the tag selection.
You will have a chance in a later step to select Pump 2, Pump 3, etc.
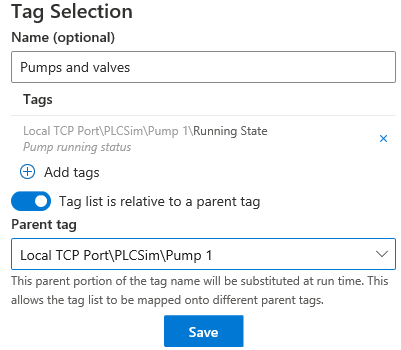
The tag list consists of one tag: Running State. It's parent is identified as Pump 1.
- After selecting Save, you are returned to the Tag History Query panel. Note the new option, circled in the following figure.
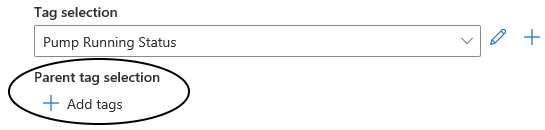
Parent tag selection is available only when the tag list is flagged as relative to a parent tag
- Select the Add tags tool below Parent tag selection.
The Tag Browser reopens.- Select the parent tags that include the tag(s) you chose in the previous step.
Note that you must select the parent as indicated earlier. In this example, those are Pumps. If you select a grandparent instead, VTScada will not search it for all the matching parents that it might contain.
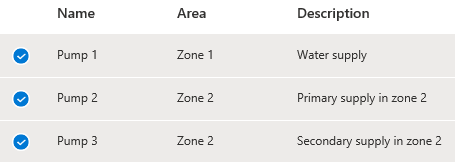
A set of selected parent tags.
- Finish by clicking the Add selected tool, then Save.
You are returned to the Query panel, which will display the named Tag Selection and the set of selected parents that contain tags in that named selection.
A tag selection that is relative to a set of parent tags.
All times are specified using the current time zone as set for your workstation. You do not need to calculate for UTC time values.
You can specify either a fixed time range with a defined beginning and end:
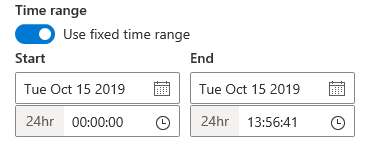
A sample fixed time range.
Or, you can specify a time range that is in some way relative to when the report is run. This option is more likely for reports that you save in order to run on a regular basis.
Three groups of preset relative time ranges are provided (Relative to now. Relative to the start of the day or week. Previous day or week.), with each group holding several options. You can select any of these to use as-in, modify one for your own purposes, or create your own.
The same tools are used both to edit and to create time ranges, therefore these notes will describe only the process of creating a new range.
- Select the "Create a new time range" tool.
The Time Range panel opens
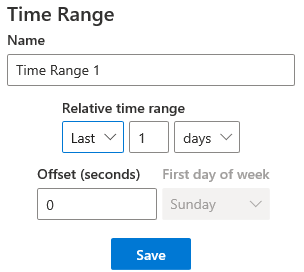
The time range creation tools
- Give the range a descriptive name.
- Using the three tools in the Relative time range section:
- Choose between Last, Current, or Previous
- Set the number of time units
- Set the size of the time units, ranging from minutes to years.
- Optionally, set an offset measured in seconds, into the range.
- If you chose "weeks" as the size of the time units, then you have the option of specifying the first day of the week. Sunday is the default.
- Select Save.
The time range panel will close, returning you to the Tag History Query panel.
Choose between calculated data and raw data (value property). If you select raw data, there are no other choices to make in this section. Note that raw data, even for a short time span, can require many rows.
There are more options for calculated data:
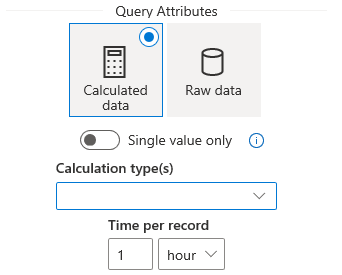
Default query attributes section of the Tag History Query panel
Use "Single value only" to run the selected calculations for all values in the time frame as a whole. For example, the average, minimum and maximum temperature values recorded yesterday. Or, you can repeat those calculations every X time units over the time frame. For example, hourly averages yesterday.
To display both, you could create a second query, located in a cell below the first, or you could use Excel tools to calculate a grand total.
The Calculation types selection tool allows you to choose as many as you like of:
- Average
- Minimum
- Maximum
- Total
- Change in value
- Value at start (snapshot)
- Time of minimum
- Time of maximum
- Number of starts (zero to non-zero transitions)
- Runtime (non-zero time)
Each selected calculation adds another column for each tag in the selection set. Columns are ordered first by tags, then by calculation for each tag.
Calculations are performed for data collected over a time span (the time per record). For example the average of an hour's data, or the maximum of a day's data. For calculated data, timestamps always indicate the start of each time span.
The following options are available to refine your query:
- By default, queries are limited to 10,000 records. You may adjust this number as required.
- You may choose to include a timestamp column (not included when calculating a single value for the entire time range).
- You may choose to sort by timestamp in descending order rather than the default of ascending (older later).
- You may choose to include title row above the columns (default)
- Format the cell data type according to the result returned rather than allowing Excel to choose. The add-in performs the following formatting:
- converts timestamps to yyyy-mm-dd HH:mm:ss
- converts values to integer or double depending on the tag type
- converts Runtimes to HHH:mm:ss
- To change this after running a report once, you may need to format the result cells as "general" before running the report again.
- Adjust column widths to fit. Ensures that each tag title is fully displayed.
- Flip rows and columns. Given cell A1 as the location for the query result, the default is to display titles in row 1 with data filling downward through the rows. Select this to place titles in Column A with data filling to the right through the columns.
When ready, select the Run button. Output will go to the indicated row and column. After running once, the space required by the output is displayed and you have the option run the query again or to save.
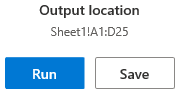
Options after the first run of the query.
Your saved queries for the current workbook are available in the Tag History Queries panel. (The default panel opened by the History tool in the VTScada toolbar, and when none of the sub-panels used to generate a query are open.)
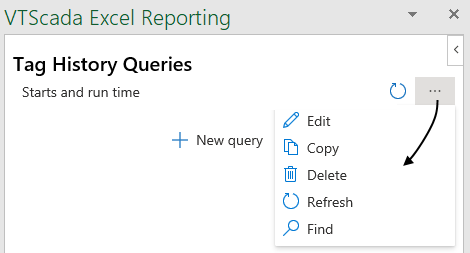
The panel with one query: "Starts and run time"
The default tool for each query is Refresh, as indicated by the circular arrow. If your workbook has more than one query, there will be a Refresh All tool.
Expand the menu to access other tools as shown. Of particular note is Find. This tool will select all the cells in the worksheet that are the result of a query.
Move a query result to a new location
Queries are tied to the cell and worksheet that was selected when you began the process of creating the query. To move the result to a new location:
- Refresh the query.
- Select the Find tool from the menu.
The cells holding the query result will be selected on the worksheet.- Cut those cells.
- Paste them to a new location on the worksheet.
