Historian Status Widget
You can monitor the operational status of all of the Historian tags in your application using the Historian Status widget. Many developers choose to create a page that is dedicated to monitoring the state of their application. The Historian Status widget is usually placed in a prominent location on such a page.
You can find this widget in the palette folder: Analytics >> Trends & Historical Data
There are no user-configurable options available in the properties dialog for this widget.
The Historian Status display will be blank while you are working in Idea Studio. Refer to the live page to see the status display.
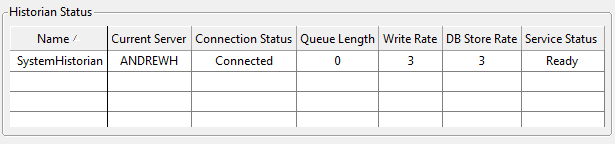
All Historian tags in your application will be listed. The grid can be sorted on any column and in either ascending or descending order. Click on the title of any column - once to sort in ascending order and twice to sort in descending order.
Note that the information displayed is from the perspective of the local machine because Historians are both services and tags (much like device drivers).
Current Server and Connection Status:
An Historian is a tag. On any given computer it may running as a primary server, backup server or a client. Current Server shows which machine is considered to be the server for the locally running Historian. The connection status refers to the connection between the Historian and its data store location.
It is possible to monitor the connection to any particular server for a given Historian and therefore to trigger an alarm in the event that the connection is lost - see: Use an Expression to Monitor the Connection.
Shows the number of records in memory, waiting to be written. This number will normally fluctuate slightly with system activity. An ever-increasing value indicates that the hard drive or database cannot keep pace with the data being collected by the Historian and may be taken as a warning of data storage difficulties.
Shows the number of records per second being added to the queue. The DB Store Rate shows the number of records being processed by the database each second. A Write Rate that is consistently higher than the DB Store Rate indicates that the Historian is collecting data faster than the hard drive or database program is able to store it. If this is the case, you should look for ways to improve the performance of the data storage mechanism.
The message in the Status column will change depending on the Historian's activity.
"Ready" indicates that, so far as can be found on the current computer, the Historian service is synchronized and is ready to accept records to be written.
"Waiting" indicates that the Historian is waiting for synchronization to finish, or that the service is unavailable.
If the Historian is synchronizing data across servers, the message will indicate the status of that synchronization.
Analytics\Trends & Historical Data\
Analytics\Statistics\
Analytics\Diagnostics\
Tools\System Status Tools\
