Site Details Page
The Site Details page shows communication, alarm and I/O information for site and station tags. These include the Polling Driver, DataFlow RTU, MultiSmart, MPE Duplexer, and MPE SC tag types, as well as all custom types that you create, based on Context tags.
The Site Details page is automatically generated for you by VTScada. It can be opened within the Sites page or as a pop-up page. You may choose to use pages of your own creation instead, on a site-by-site basis.
Example for a Polling Driver site, as viewed within the Sites page
There are four methods that operators can use to open this page:
- Click on a site that is included in the list of the Sites page.
- If you use the Site Draw widget to draw a Polling tag or DataFlow RTU, then operators can click on the Site Draw to open this page.
- If you have drawn any of the available site types as a Site Icon or Site Summary, (this includes a pin, drawn on a Site Map), then operators can open the Site Details page by clicking on the icon or pin.
- You can draw the page within any other application page. In general, this method is discouraged in favor of the previous three. You are likely to encounter scaling problems when the Site Details is drawn inside a standard VTScada page.
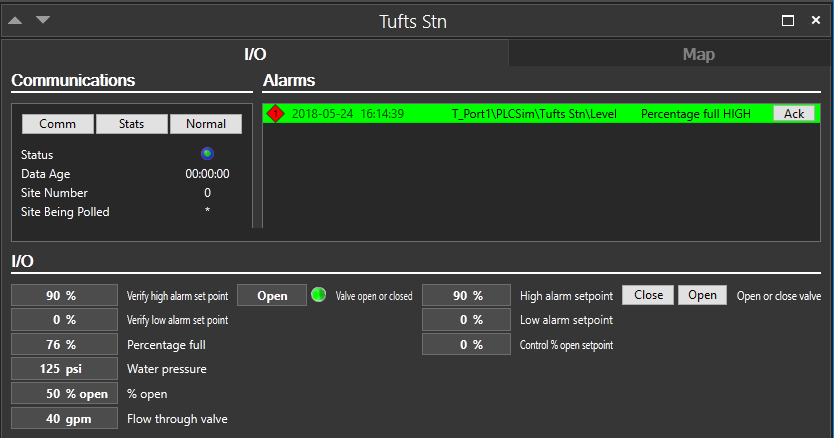
Components of the Site Details page:
Title Bar Controls
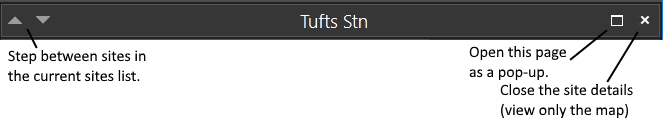
Visible only when the Site Details is viewed as a component of the Sites page, not as a pop-up.
Tabs:
Every Site Details page has two tabs: I/O and Map. The map is simply a Site Map, showing the location of the station.
Driver Statistics Section:
Applies only to sites that are Polling drivers or DataFlow Station drivers. Visible when the I/O tab is selected. Shows statistics associated with the driver. Also included are buttons that open the Comm Messages dialog or the Comm Statistics dialog for the driver.
Alarms Section:
The Alarms list will be populated with all current alarms associated with the driver. Operators may use the Ack button here to acknowledge any given alarm.
Only alarms whose area matches the area of the site tag will be displayed. If two site tags share the same area, it is possible to see alarms from both. In general, each site tag should have its own area.
I/O Section:
All of the I/O tags associated with the site are shown at the bottom of the page. These are grouped into separate columns according to the type of I/O: analog or digital, input or output. Input tags that allow writing are still considered input tags. Selector switch tags are included with the digital outputs.
Any unacknowledged alarm on an I/O tag will be indicated by the color red. Red text for analog tags and a red dot for digitals. Controls are provided for all output tags associated with the station.
The application property, SiteToolsConfirmOutput, controls whether a confirmation prompt will be shown before new output values are sent.
If the site tag has a parameter named CustomSiteListFilterType, then the I/O list will be filtered to show only the type, or types in the group, specified for that parameter.
You can change the background color of the page by adding the application property, ThemedPageBGColor.
