Sparklines Widget
Used by: I/O and Calculations tag (although portions may be used by any numeric tag).
The Sparklines widget is similar to a Plot widget but allows operators to see at a glance whether the tag has values below, within, or above the expected range.
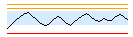
A Sparklines widget for an I/O tag, showing the expected range (blue band),
a low alarm, high alarm and high-high alarm.
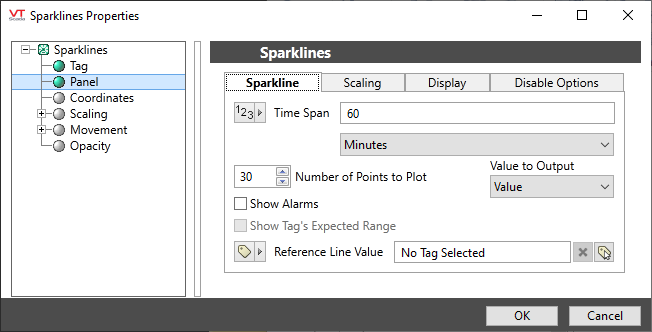
The Sparklines properties dialog, Sparkline tab
Time Span
Set the length of time to be represented by the widget.
The time span cannot be less than one minute or greater than one year. The numeric control will allow only integer values, so if you need a time span of (for example) a day and a half, set it to 36 hours.
Number of points to plot
Use this to control how many historic values are averaged for each point in the sparkline.
Note that the widget is also constrained by its size on the screen. While you can set this number as high as 720, a widget that is 100 pixels wide on the screen can show only 100 points.
Value to Output
For a numeric tag, the only option is "Value" - the value of the tag.
For a driver, this can be any of the numeric, logged values, defaulting to ErrorValue.
Show Alarms
If selected, horizontal lines will be drawn for the current setpoint of all configured alarms in the tag, using the appropriate color for each alarm's priority.
Show tag's expected range
Enabled only when the widget is linked to an I/O and Calculations tag.
A band within the expected values from that tag is shown shaded in the widget. Shading uses colors from the selected
Reference line value
Adds a line to the graph that can be used as a target reference. You can use any of three methods to set the value for this line: directly within the widget, from another selected tag's value, or from an expression. If selecting a tag, any of the following may be used: I/O and Calculations, Analog Status, Digital Status, PLC Alarm, Pump Status, Analog Input.
If the value used for the reference line is outside the scale range, it will not be drawn.
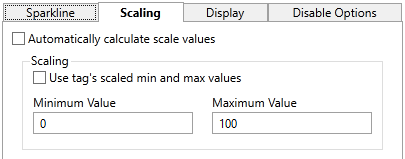
Scaling tab of the Sparklines widget
If the automatic option is selected, the spark line will continuously scale so that the minimum and maximum values within the displayed range fill the vertical space of the widget.
You can choose to use the tag's scaled minimum and maximum values instead or assign your own values using the space provided.
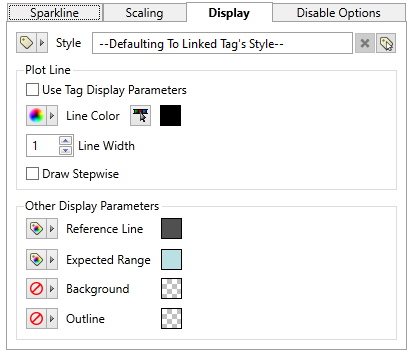
Display tab of the Sparklines widget
The option to use tag display parameters is available only when the widget is linked to an I/O and Calculations tag, and display parameters are set within that tag.
By default, the Sparkline is a one-pixel wide black line, drawn smoothly through the data points. You may select any color and width you choose.
Other display parameters are as shown. By default, the background and outline are invisible, but you may add them using colors of your choice.
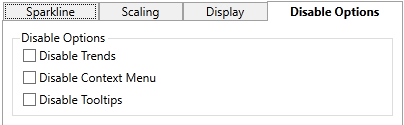
Disable Options tab of the Sparklines widget
Disable Options
Disable selected operator-interaction features of this widget.
See: Operator Interaction Controls
Analytics\Trends & Historical Data\
High Performance\
