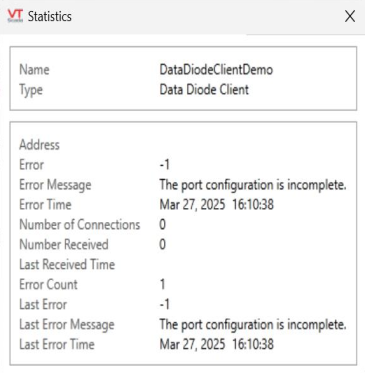
Data Diode Client Statistics Dialog
The Show Stats button will display the following information about a Data Diode Client tag.

Name The name of the client tag for which statistics are being displayed.
Type The type of tag for which statistics are being displayed.
Address The address configured for the linked communication tag.
Error The error number (code) for the current error.
Error Message A message describing the type of communications error that has occurred.
Error Time The time of the last reported error.
Number of Connections The number of active connections between the Data Diode and VTScada
Number Received The number of packets received.
Last Received Time The time of the last transmission.
Error Count The number of errors that have occurred since the system started.
Last Error The error number (code) for the current error.
Last Error Message A message describing the type of communications error that last occurred.
Last Error Time The time of the last reported error.
You can quickly draw this widget by right-clicking the Data Diode Client tag in the tag browser and selecting "Draw". Navigate to the Diagnostics folder and select Comm Stats Btn.
To find the Comm Stats Btn from the widget pallet in Idea Studio, go to Analytics > Diagnostics.
