HDV Grid as a Reporting Tool
Values that make up the Historical Data Viewer (HDV) graph can be viewed in a table by clicking the Grid tab at the bottom of the page.
Selecting the Grid tab.
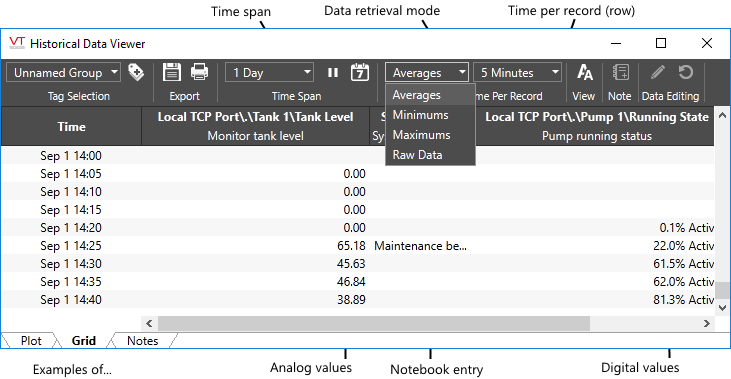
The grid is a powerful tool for viewing a report of process values. You may choose to view raw values as logged or you can select averages, minimums or maximums over a given amount of time per record (row). Note that the list of available Time Per Record options will not include a value larger than the selected time span of the grid. Also, values that are significantly smaller than the displayed range will not be available.
As an example, you might configure the grid to display maximum values recorded in each fifteen-minute time span for the past day. For a finely-detailed report, you might configure the grid to show average values for each one-minute time span (or less) over the past week. Any combination that you configure may then be exported to a file for use in a report. A significant advantage to using averages over small time spans is that the time stamps will match for each tag's value, which will not be the case when exporting raw data.
Toolbar entries not labeled here are described in HDV Element Reference.
There is one column for every tag that was plotted in the HDV. Columns can be re-sized by clicking and dragging on the edges of their titles. Whenever the window is re-sized, all the columns will also re-size automatically in an attempt to display as much of each tag name as possible. A horizontal scroll bar may be added if any portion of the columns does not fit within the window area.
To re-order the columns, change their order in the tag selector.
Raw Values Data Retrieval Mode
If viewing raw values for more than one tag, you might notice that some entries are gray and some are black. Values tend to be logged a few milliseconds apart and sorting of the rows is done by timestamp. For each row, there will be at least one entry in black, showing the value logged at that timestamp. Rather than leave other columns blank, their last logged value is carried forward, but shown in gray.
When exporting raw data, timestamps are truncated to the nearest second. If greater accuracy is required, use a standard report. Reports Page
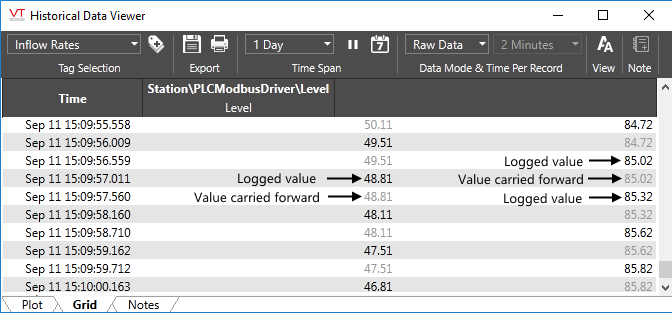
Raw data example showing millisecond differences between logging events.
Average, Minimum or Maximum Data Retrieval Mode
For each tag, all logged values within the chosen Time per Record will be used for the selected calculation. The result will be evenly-spaced time intervals with a calculated value for every tag at each time interval.
Averaged Values and Digital Tags
When viewing averaged values, Digital tags will periodically display a message such as "99.8% Active". This is the percentage of the non-zero, logged values for the time period covered by that row.
