Digital Pen Property Reference
The appearance of the pens that are used to display digital plots can be adjusted as follows:
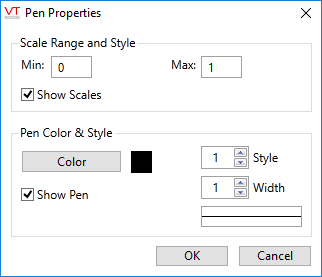
- Double-click the entry, or click the gear icon to open the properties dialog.
| Digital Pen Properties Element | Description |
|---|---|
| Min & Max | The range of the displayed scale. 0 and 1 for most digitals, but may be set 0 to 3 for two-bit digital inputs. |
| Show Scales | Select whether the minimum and maximum scale values are to display along the Y-axis of the graph. |
| Color | Opens the Select Color palette, which you can use to select a new color for the pen. |
| Style | A spin-box that you can use to change the line style (solid, dashed, etc.). Affects the choice of width, in that you cannot select a wide line for any style other than solid. |
| Width | A spin-box that you can use to set the width of the pen. Affects the choice of style, in that choosing a wider line forces the line style to be solid. |
| Show Pen | Hides this tag's pen when not checked. |
| Average | Affects the legend display. If checked, the average of all plotted values across the displayed time span will be calculated for the tag. |
