When the Historical Data Viewer (HDV) opens and tags are selected, the display is of live data - that is, a constantly updating display of values as they are being collected.
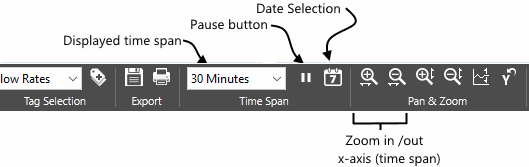
You may wish to adjust the displayed time span to show a greater or shorter length of time. If the values are being logged, then you can also change the displayed time to review historical values. Most of the tools that you will need can be found in the toolbar at the top of the HDV page.
Change the displayed start date:
- Click the Set Start Date button.
- Use the single arrow buttons to move backwards and forwards through the months, the double arrows to move a year at a time, click the date to switch to a month selector.
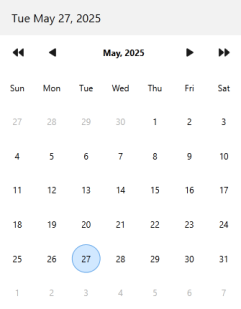
- Click on the date for which you want to start viewing logged data.
The calendar closes, and the date you selected is displayed below the graph.
Change the span of time displayed (method 1):
- Click the duration drop-down list. (To the immediate left of the Select Start Date button.)
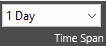
- Select a time duration from the list
Change the span of time displayed (method 2):
The Zoom in X-axis and the Zoom out X-axis buttons combine two steps in one. The first is exactly the same as using the time span selector - each change in time span made using these buttons is the same as selecting the next duration from the list. The second function is that they scroll the history display to center the time that you click within the time span window.
- Click either the Zoom in X-axis or Zoom out X-axis button to active the control.

- Click on the graph to change the displayed duration and re-center the graph.
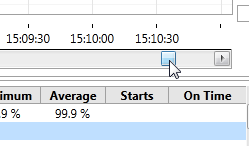
Scroll to view earlier or later dates:
The scroll bar below the graph can be used to view earlier or later dates. Click on the left and right arrows, or drag the indicator.
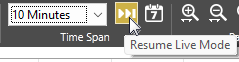
Reset the graph to the current date:
If you are not viewing current / live values, then the indicator to the left of the calendar button will be highlighted. Click the button to return the graph to the current time and live updates.