Mobile Internet Client - Application Pages
Application pages can be viewed in either of two formats: A list designed for minimal bandwidth, or a graphic view of the application page, scaled to fit your device's display.
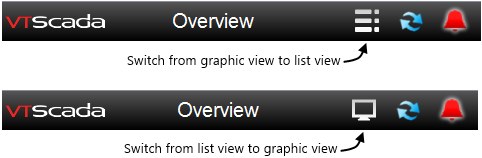
Toggle controls for the MIC display
To return to the main menu from any page, touch the VTScada logo at the top left corner of the display.
List View:
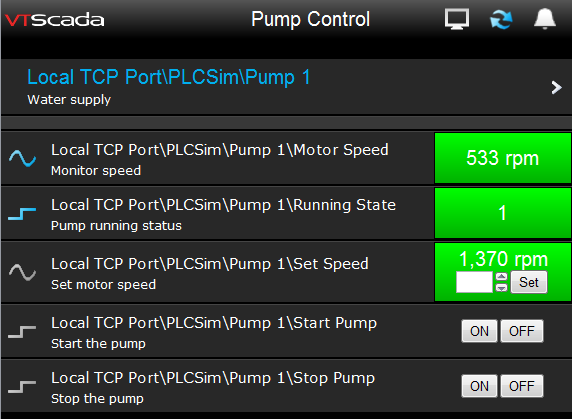
Optimized view, matching the following figure.
Tag values, as of the last browser-refresh, are shown to the right of each tag name. If a tag is in an alarm state, the value will be shown in red.
Graphic View:
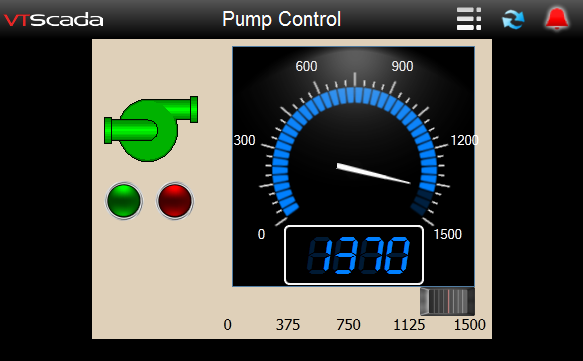
Standard (graphic) view, matching the preceding figure.
The graphic view matching the preceding list view. (Taken from the Completed Tutorial Application.) All widgets are fully functional, but page hotboxes may not be visible on every device and touching a slider opens a data entry field rather than sliding the control to a new value. As with other MIC pages, this view is not updated continuously.
A touch on a widget in the graphic view will cause a dialog window to open. If the tag can be viewed in the HDV, a link will offer the option of opening a trend window. If a control tag is clicked, the window will provide an output control for that tag.
Updating a graphic view that contains many widgets can involve a significant data transfer to your mobile device.
In the list view, analog tags are indicated by a sine wave symbol. Digital tags are indicated by a square wave.
If the symbol is blue, the tag's values can be plotted. You can touch anywhere on the tag row to open a trend graph, just as you can click on a tag on a VTScada page to do the same. Touch a second tag to view multiple pens on the same graph. Each tag will be plotted in a different color, as indicated by a matching highlight color around the tag's row in the display.
Touch on the tag symbol a second time to remove the pen from the graph. When the last pen has been removed, the trend graph will close, or you can click the X at the top of the graph to close it immediately for all pens.
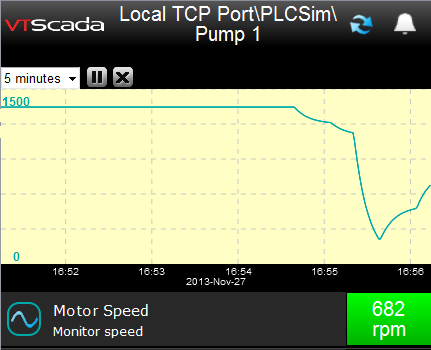
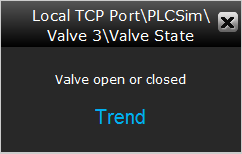
HDV trend graph in the MIC
In the graphic view, the trend graph works much like it would on a VTScada workstation. Touching a tag will open a full-screen trend graph. (You will be prompted as to whether you meant to open that graph.)
You can drag the graph left and right to change the displayed time period. If your device supports the "pinch" user interface, drag two fingers together or apart to change the scale of the display. Use the control at the top of the graph to display a time frame other than the default of one hour.
Controls at the top of the display allow you to change the amount of time displayed.
