Alarm Reports
Alarm reports help you to identify trouble spots, whether the cause of the trouble is in the physical system or in the configuration of your application. Most alarm report are presented as Alarm Lists, meaning that the usual filters and display options are available to help you focus on areas of interest in a report.
Alarm Lists are alarm reports. You can copy the filtered list to your Windows clipboard and then paste it into a document, a spreadsheet, or any other program.
In addition, there are several preconfigured filters, available via the toolbar button, "Alarm Reports". These are described in the following notes.
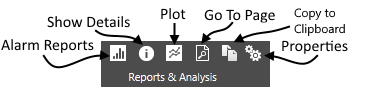
Toolbar detail.
On the Anywhere thin client, "Copy to Clipboard" is replaced by "Export to CSV file".
By default, each report shows a 30-day time period, but you may adjust this as needed. Reports show only Active and Trip alarm events unless you filter for other events.
Any filter that you select will remain in effect while you switch from one report to the next. This can be helpful for gathering more information about an event. For example, you might start by identifying a day on which an alarm flood occurred in the Alarm Flood report. Clicking on that bar in the graph filters the display to one day. You might then view the History report of alarms for that day to see which ones were part of the flood. You might then add name filters to view all the occurrences of one alarm at a time on that day.
As with any alarm list viewed on a VTScada workstation, you can use the keyboard combination, Ctrl+C to copy all information shown in the list, then paste that information into a spreadsheet.
A bad actor is an alarm that is activated or tripped an excessive number of times within a time period. This may indicate a problem with equipment, with a process, or with the configuration of that alarm.
A common misconfiguration is to put an alarm on a normal process in order to create a report of the times when an expected event occurs. Do not do that. There are better ways to create reports.
The Bad Actors report shows all alarms that occurred within the time period, sorted by the number of times they were activated or tripped. This does not imply that all the alarms listed are bad actors. The purpose of the report is to help you find those that might be classified as such.
This report can be copied to the Windows clipboard by pressing Ctrl+C or using the Copy to Clipboard tool, then pasted to a spreadsheet. The columns Priority, Area, Name, Description, Count and Percent will be included.
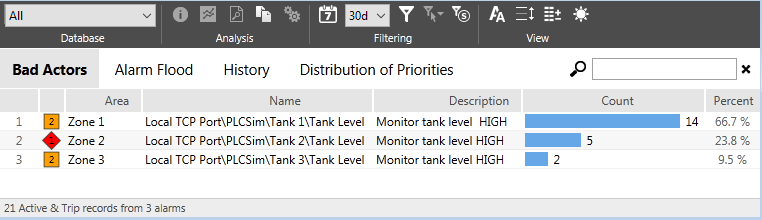
All alarms are included. Only those with unusually high counts are "bad actors".
The Alarm Flood report shows a bar graph of the number of alarm occurrences within the selected time period. The information shown in this report is not restricted to alarm flood events but will help you to identify any that may have occurred.
The time covered by each bar in the graph varies depending on the length of the selected time period. Each bar may represent a day or may represent only a portion of a day.
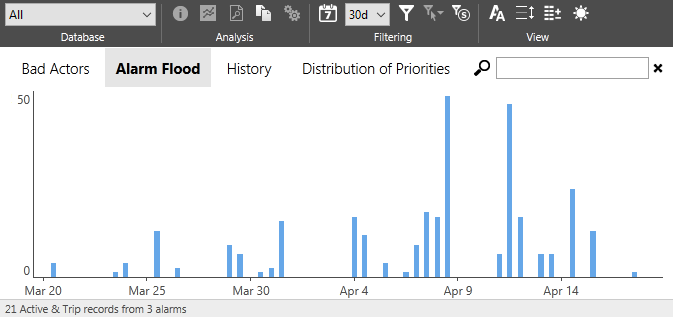
Alarm floods are indicated by unusually tall bars.
As you move the pointer over the graph, it will appear as a cross-hair, with a vertical highlight matching the selected time slice. A tooltip window will follow the cross-hair, identifying the date range of the selected time slice and the number of alarms that were activated or tripped within it.
You can left-click on the graph to change the displayed range to a single day, within which each bar / time slice shows a half-hour interval. Right-click to return to the previous time range.
The History Report is identical to the History list from the Alarm Page, except that it is prefiltered to show only Active and Trip alarm events.
This report can be copied to the Windows clipboard by pressing Ctrl+C or using the Copy to Clipboard tool, then pasted to a spreadsheet. All columns will be included.
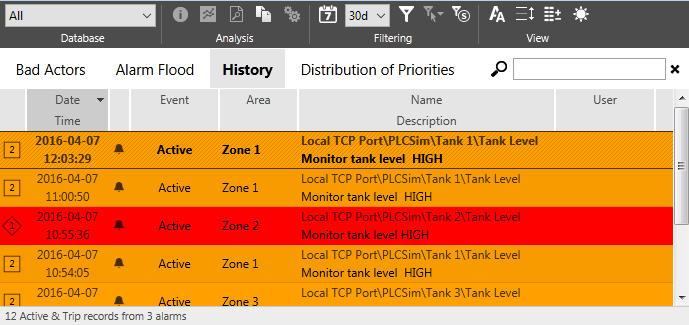
A history report
Select any alarm event in the list then use the tools from the Analysis portion of the toolbar to gather more information about it.
This report can be used by VTScada developers to help them design the application's alarm system to follow the ISA 18.2 standard.
The left-most graph shows the number of alarms activations and trip events within the selected time period, grouped by priority. This reflects the reality of current operations.
For those who are interested in ISA 18.2 compliance, the middle graph and the right-most graph should be used together. The standard recommends that only five percent of configured alarms be critical priority, and fifteen percent be high priority. The alarm configuration of your application is shown in the middle graph.
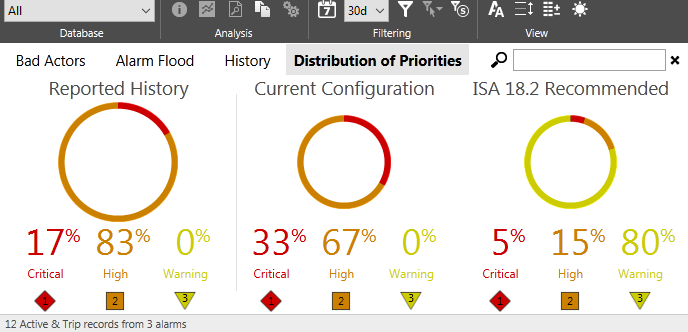
A sample configuration compared to the ISA 18.2 recommendation
The ISA 18.2 standard is available from the ANSI / ISA website at: https://webstore.ansi.org/standards/isa/ansiisa182016
