(Engine-Level Function)
| Description: |
Queries an Historian data store and returns an array of processed records. For most uses, GetTagHistory is recommended in place of HistorianGetData. |
| Returns: | Invalid if parameters are invalid, otherwise 0. |
Usage:  |
Script Only. |
| Threaded: | Yes |
| Related to: | HistorianConnect | HistorianDeleteRecords | HistorianGetInfo | HistorianReadRecords | HistorianWriteRecords |
| Format: |
HistorianGetData (ConnectionHandle, TagName, Schema, Data, FieldNames, TPP, StartTime, EndTime, NumEntries, Modes, StaleTimes, LastRestartTime, ErrorCode) |
| Parameters: |
| ConnectionHandle | ||||||||||||||||||||||||||||||||
| As returned by an HistorianConnect call. | ||||||||||||||||||||||||||||||||
| TagName | ||||||||||||||||||||||||||||||||
| A text string representing the desired table name. Engine code may modify this to conform with storage limitations. | ||||||||||||||||||||||||||||||||
| Schema | ||||||||||||||||||||||||||||||||
| A text expression describing the schema from which to retrieve data. | ||||||||||||||||||||||||||||||||
| Data | ||||||||||||||||||||||||||||||||
| A variable in which the data will be returned. This will be a two-dimensional array representing the returned data, indexed by [col][row]. If TPP is non-zero, the number of rows in the result set will equal the value of the NumEntries parameter. If TPP is zero there could be fewer rows than specified by NumEntries |
||||||||||||||||||||||||||||||||
| FieldNames | ||||||||||||||||||||||||||||||||
| Names of the fields. Typically "Value" for most tag values, or "Value!" for tag attribute data. (Value! was introduced with VTScada version 12 and is not available in legacy data. It cannot be retrieved by SQL queries.) |
||||||||||||||||||||||||||||||||
| TPP | ||||||||||||||||||||||||||||||||
| Required. Any numeric expression giving the time span in seconds for each array entry. Each array element will contain the data which correspond exactly to this time period which corresponds to 0 or more data points. If TPP is positive and FieldNames selects a text value, the first entry which falls in a time is read and Mode is ignored. If TPP is equal to 0, the data is read and placed in the array on a one to one basis. If TPP is less than 0, an error will be returned. |
||||||||||||||||||||||||||||||||
| StartTime | ||||||||||||||||||||||||||||||||
| Timestamp in UTC. The report will include values matching and later than this time. | ||||||||||||||||||||||||||||||||
| EndTime | ||||||||||||||||||||||||||||||||
| Ending timestamp. Ignored if TPP is non-zero. The report will include values less than and matching this value. | ||||||||||||||||||||||||||||||||
| NumEntries | ||||||||||||||||||||||||||||||||
| Number of log entries in the array (numEntriesRequested - determined by Size or TPP parameters of Getlog) Use a negative value to retrieve values in reverse chronological order. |
||||||||||||||||||||||||||||||||
| Modes | ||||||||||||||||||||||||||||||||
|
Optional numeric expression giving the method of handling the data. If TPP is greater than 0, the values that fall in each time span will be represented as follows:
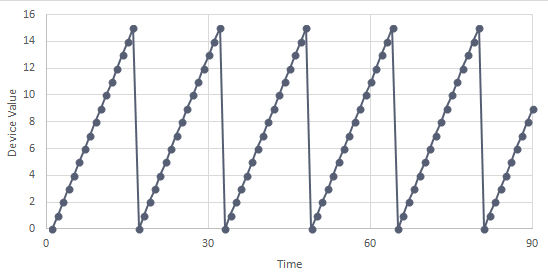
Mode 11: This is for hardware that can count to a limited number, then rolls over to start a fresh count. For example, a tag that counts equipment starts, but which can only count from 0 to 15 before wrapping around to start again. This gives a value of sixteen per roll-over since there must be one more start after fifteen to have the roll-over occur. A graph of a very simple case where there is a start every second would look like the following:
(Each rollover must be followed by a fresh start, not a gradually declining value. If there are a series of declining values then, because each is less than the previous, each counts as another rollover.) The formula used is (RolloverCount * RolloverValue) + (LastValidValue - FirstValidValue). Where, for any given time interval:
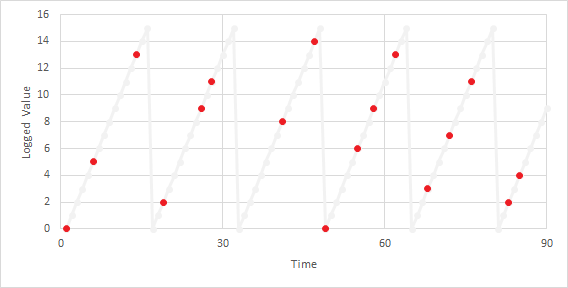
Given this example, suppose that you want a count of starts in each thirty-second interval. In the first interval there is no previous valid value, one wrap-around and a last valid value of 12. (1*16) + (12 - 0) = 28. This is an idealized case. Consider a more realistic case where not all values are logged. (This may be due to factors such as polling intervals, deadbands, hardware, etc.) The following graph shows the same data where the orange dots represent values obtained and logged and the gray line represents what really happened:
In the first 30 seconds there is one roll-over when the value drops from 13 to 2. The first value is 0 and the last is 11. The Historian will return 27: (1*16) + (11-0) = 27. The Historian will return 30 for the period from 30 to 60. The first valid value (carried from the previous period) is 11. The last valid value is 9 and there are two roll-overs. (2*16) + (9-11) = 30. Modes 12 and 13: These are intended to provide a summary of the bit-wise Historian value attributes within a query. (Value attributes were added in VTScada version 11.5 / 12.0) With mode 12, the first value is OR'd with zero, and each successive value in the time period is OR'd with result of the last comparison. From the result you will know whether any particular attribute bit was set on any values within the period. With mode 13, the first value is AND'd with a value having all bits set to 1 and each successive value is AND'd with the result of the last comparison. From the result you will know whether any particular attribute bit was set on all values within the period. In the case of modes 5 and 6, FieldName should still be set to indicate the field on which the mode is to act. The return values will be times indicating the maximum or minimum in that field for each time span. If TPP is less than or equal to 0, Mode is ignored. If the data is text, the first entry in a given time range is used for the array entry and Mode is ignored. It is possible to retrieve more than one mode in a single GetTagHistory statement. To do this, pass an array of values in as the Mode parameter. |
| StaleTimes |
|
The meaning of StaleTime depends on the selected Mode. For Mode 11, this is the maximum value of a range (see comments in the Mode parameter.). |
| LastRestartTime |
| A Timestamp value used in UpTime processing. (see comments) |
| ErrorCode |
|
A value in which the error code (if any) will be returned. Defined error codes are provided in the reference chapter. See: Historian Error Codes |
| Comments: |
If a record has been written that duplicates the timestamp of an existing record then, when reading, the newer record will be supplied in place of the older. This arbitration is performed by means of a Secondary (or Generation) Timestamp. No downtime invalids are inserted when reading in the reverse order. Version 12 of VTScada introduced value attributes. These can be queried using "Value!" rather than "Value" for the field name or array of field names. Value! stores bitwise values according the following table. Attributes flagged with a star (*) apply only if the I/O tag is attached to a DNP3 driver or a custom driver supporting this feature. Refer to the constant, #NUM_DATA_ATTR_BITS, to discover the number of bits in data attributes for your version of VTScada.
|
Example:
No example provided. This function is not recommended for most use.
