(Engine-Level Function)
| Description: | Displays a plot of a subsection of a numeric array in a particular area of the window. |
| Returns: | Nothing |
Usage:  |
Steady State only. |
| Function Groups: | Graphics |
| Related to: | PlotBuff | PlotXY |
| Format: |
Format version 1:
Format version 2:
Plot takes the first parameter set or else detects that the Style parameter is a Pen, in which case the second parameter set is used. |
| Parameters: |
| ArrayElem |
| Required. Any numeric expression specifying the starting array element to plot. If processing a multidimensional array, only the right-most dimension is used. |
| N |
| Required. Any numeric expression giving the number of array elements to plot starting at the element given by the first parameter. N must be greater than or equal to 2, and no greater than 32000. If this parameter is greater than the dimension of the first array, the number of points plotted will be the array dimension. If N extends past the upper bound of the lowest array dimension, this computation will "wrap-around" and resume at element 0, until N elements have been processed. |
| Low |
| Required. Any numeric expression that defines the limit of data values to be plotted. This value need not be less than High but must not be equal to it. In the standard case, when this value is less than High, it will define the minimum value to display. For example, if Low was 10, a data value of 10 would fall on the edge of the bounding box, on either the line described by X1, if the plot is vertical, or on the line described by Y1, if the plot is horizontal. Any values below 10 in this case would not be shown since they would be outside the clipped box. |
| High |
| Required. Any numeric expression that defines the limit of data values to be plotted. This value need not be greater than Low but must not be equal to it. In the standard case, when this value is greater than Low, it will define the maximum value to display. For example, if High was 1000, a data value of 1000 would fall on the edge of the bounding box, on either the line described by X2, if the plot is vertical, or on the line described by Y2, if the plot is horizontal. Any values above 1000 in this case would not be shown since they would be outside the clipped box. |
| X1 (Left) |
| Required. Any numeric expression giving the X coordinate on the screen of the left side of the plot area. For horizontal plots, this is the screen coordinate of the first point or bar plotted. For vertical plots, this is the value which corresponds to the Low parameter value. For vertical bar plots, X1 is the base coordinate for the bars. |
| Y1 (Bottom) |
| Required. Any numeric expression giving the Y coordinate on the screen of bottom side of the plot area. For vertical plots, this is the screen coordinate of the first point or bar plotted. For horizontal plots, this is the value which corresponds to the Low parameter value. For horizontal bar plots, Y1 is the base coordinate for the bars. |
| X2 (Right) |
| Required. Any numeric expression giving the X coordinate on the screen of the right side of the plot area. For horizontal plots, this is the screen coordinate of the last point or bar plotted. For vertical plots, this is the value which corresponds to the High parameter value. |
| Y2 (Top) |
| Required. Any numeric expression giving the Y coordinate on the screen of the top side of the plot area. For vertical plots, this is the screen coordinate of the last point or bar plotted. For horizontal plots, this is the value which corresponds to the High parameter value. |
| Style |
| Required (Format version 1 only). Any numeric expression giving the style of the plot. The plot Style gives the line style, direction, bit number for bits plots, and the number of points to average per point displayed. The Style is determined by adding together the following values: Line style + Direction + Path + Bit number + Average Line style is a number between 1 and 5 inclusive which gives the line style for line plots. A line style of 1 indicates a solid line (see Chapter 9 for more styles). For bar plots, the line style portion of the Style parameter is ignored. Direction is either 0 or 10. Use 0 for a standard horizontal plot (array index runs along the X axis and values are plotted up or down). Use 10 for a vertical plot (array index runs along the Y axis and values are plotted left or right). Path is either 0 or 50. A 0 indicates that line plots are to be drawn directly from point to point. A 50 indicates that plots are to be drawn in a step fashion with two line segments between each point. The first segment runs parallel to the X-axis and the second segment runs parallel to the Y-axis. This produces a square-looking plot. These step plots are useful for plotting status values which change in jumps rather than continuously. The Path value is ignored for bar plots. Bit number is either 0 or a value starting at 100. This is the number of the bit to use in the array data for plotting. If the normal entire value of the data is to be plotted, use 0 for this value. If only one of the bits from the data is to be plotted, use the bit number plus 1. The value to add is (Bit number + 1) * 100 or 0. The ability to plot only a single bit from an array of short or long values allows status data to be stored very efficiently by not requiring a separate array for each status value. For bit plots, the value plotted is always a 0 or a 1 corresponding to the value of the selected bit. The use of this plotting option is usually done in conjunction with a Path value of 50 for step plots. Average is either 0 or a value starting at 10000. This is the number of consecutive array points to average to give a single point on the screen. It can be used to plot a very large array of values on the screen without having to draw all of the points on the screen. This will produce a smoothed plot and reduce the drawing time. The number to add is (Data points per displayed point - 1) * 10000. |
| Color |
| Required (Format version 1 only). Any numeric expression giving the VTScada Color Palette of the line and the foreground color for filled plots. If the number is less than 10000, the plot is non-destructive. If the number is greater than or equal to 10000, the plot is destructive and the actual color used is Color - 10000. RGB color strings may not be used. |
| Pattern |
| Required (Format version 1 only). Any numeric expression giving the bar Fill Patterns for the plot. For a Pattern value of 0, the plot is a line plot. For Pattern values in the range of 1 to 25 inclusive, the plot is a bar plot with the hatch pattern corresponding to the Pattern parameter value. If the parameter is 1, the bars are a solid color and the Background parameter is ignored. |
| PatternBackground |
|
Required (Format version 1 only). Any numeric expression giving the color number of the plot fill background color. This number is ignored if the Pattern parameter is equal to 1. For values of Pattern greater than one, it gives the background color for the bar. RGB color strings may not be used. |
| Pen |
| Required (Format version 2 only). The pen to be used (if any). Must be provided, but will be ignored for bar plots. |
| Brush |
| Required (Format version 2 only). The brush to be used (if any). For line drawing, this parameter must be provided with pattern 0. |
| XORMode |
| (Format version 2 only) An optional parameter specifying whether the plot is destructive (if destructive, the plot line won't be affected by the background color). If set to 0 or Invalid (default), the destructive drawing mode will be used. If set to 1, the non-destructive or XOR drawing mode will be used. |
| Direction |
| An optional parameter specifying the horizontal or vertical direction for the plot. 0 or Invalid indicates horizontal, while 1 indicates vertical. |
| DrawStepped |
| (Format version 2 only) An optional parameter specifying whether the plot is to be drawn from point-to-point, or stepped. 0 or Invalid indicates point-to-point, while 1 indicates stepped. |
| BitNumber |
| (Format version 2 only) An optional parameter specifying the use of a whole value or a bit number. Invalid indicates a whole value should be used, while >=0 indicates that the specified bit number should be used. No default |
| Average |
| (Format version 2 only) An optional parameter specifying whether consecutive points should be averaged to give a single point. Invalid or 0 indicates that averaging should not be used, while >0 indicates that the number of consecutive points should be averaged to give a single point. No default. |
| Comments: | This function is a layered graphics statement. The Plot statement will execute timer functions during the plotting process. This will allow time critical functions such as driver I/O and data logging to continue running during the relatively long times it takes to update a plot on the screen. Through the ordering of the Low, High, X1, X2, Y1, and Y2 parameters, the plot may have 8 different orientations for line plots and 16 different orientations for bar plots. The normal left to right plot with the minimum at the bottom will have Low < High, X1 < X2, and Y1 < Y2. By exchanging Low and High (i.e. Low > High), the plot will have the minimum value at the top with bars still drawn from the bottom. Exchanging X1 and X2 (i.e. X1 > X2) will plot values from right to left. Exchanging Y1 and Y2 (i.e. Y1 > Y2) will plot values with the minimum at the top with bars being drawn from the top also. Combining these actions with the Style (horizontal or vertical) gives all possible plot orientations. The plot ignores invalid data elements in the array and leaves blank spaces for them on the display. If the number of points extends past the end of the array, the plot will continue at the first of the array until N points or all the points of the array have been plotted. The plot area defined by X1, Y1, X2, and Y2 limits the area which can be plotted on the screen. Any points which fall outside this area will not appear on the screen but will be "clipped" at the boundary. |
Example:
Given an array with 10 elements whose values range from 0 to 100.
IF Watch(1);
[
   Data = new(10);
   Data[0] = 0;
   Data[1] = 1;
   Data[2] = 20;
   Data[3] = 25;
   Data[4] = 26;
   Data[5] = 40;
   Data[6] = 55;
   Data[7] = 60;
   Data[8] = 75;
   Data[9] = 99;
]
A plot of the data may be done with the following:
Plot(data[0] { Starting element },
     10      { Number of elements to plot },
     0       { Low limit },
     100      { High limit },
     100, 150, 200, 50 { Bounding box for plot area, offset for 42 pixel title bar},
     1+10+50 { Style: Solid line style, vertical plot, step fashion },
     4       { Color: dark red},
     0       { Pattern: Line plot (not bars) },
     0       { Pattern Background: Ignored for line plot });
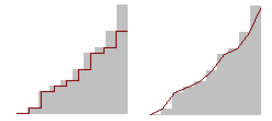
This statement will result in a line plot of 10 data points in an area in the upper left corner of the window. The line will be vertically orientated meaning that Data[0] is at the bottom left corner and each successive array value is plotted one step higher, with values increasing to the right. It is a single line in style and dark red in color. It will follow a step pattern. That is, it will look like the outline of a bar graph of the points.
Warning: when drawing a stepped line plot, the final vertical rise will be clipped:
Example 2:
Plotting the same values as a horizontal plot, using Pen and Brush values:
Plot(Data[0],
     10,
     0,
     100,
     200, 150, 300, 50,
     Pen("<FFFFFF00>" { yellow }, 3 { dotted }, 2 { pixel width }),
     Brush("<FFFFFF>", 0, 2 { Stripe pattern });
     {, XORMode, Direction, DrawStepped, BitNumber, Average});
