Monitor Modules and Variables
It is helpful to be able to use the Source Debugger while learning the concepts presented in this chapter. Therefore, this introductory topic describes a few basic tasks that you can accomplish with the Source Debugger without needing to know all the features of that powerful tool.
The Source Debugger application is included with every copy of VTScada and should be available in the VTScada Application Manager. If not, you may need to load it using the Find Existing option of the Add Application Wizard.
Upon starting the Source Debugger, the Summary (Live) screen will take up the main part of the display. The list of running applications will be expanded.
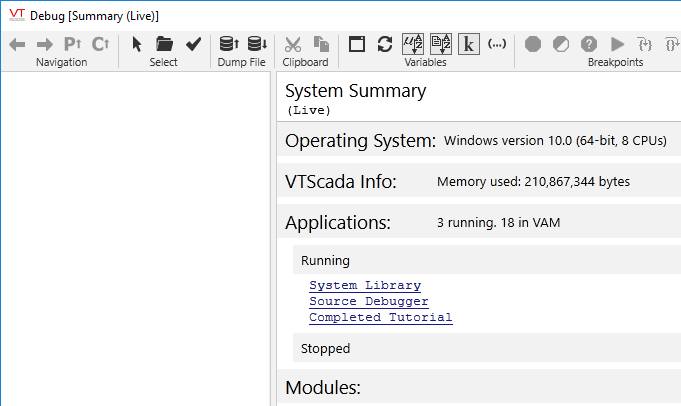
Detail from the Source Debugger
While you can examine any running application including the System Library, the Source Debugger will show source code only if that code is available on your workstation. You can (for example) see how many Analog Status tags are running, and examine the values and parameters within each, but you cannot view the code within the Analog Status tag.
Using the Completed Tutorial application as an example, if you were to click this link in the Summary, the module tree window (left of the System Summary) would be populated with all the modules and submodules used by that application.

Module tree of the Completed Tutorial
The default order is how these are stored within VTScada. It will be easier for you to find any given module if you first sort the tree alphabetically. Note the tool to do this, shown circled in the previous figure.
If, for example, you are interested in the Analog Status tags in the application, then after sorting the module tree, find and click on Analog Status. (The plus beside Analog Status indicates that this module contains submodules, any of which may be examined.)
The Module Content window (bottom left) will be populated with variables found in the Analog Status module.
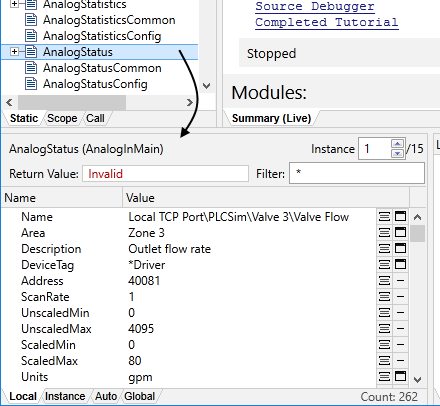
Variables within one of 15 Analog Status tags in the Completed Tutorial
Note the instance count (top right of this window). This tells you how many instances of the module are running and which one you are examining. Toggle buttons here can be used to step through these instances until you find the one you want to examine in detail.
For every variable in the module, there are two buttons (located to the right). Use these to change the display format of the information (decimal, hex, octal, etc.) or open a pop-up window with further information, if available.
If the module's source code can be found on your workstation, it will be displayed in the same window as the System (Live) view. You can add breakpoints on any line of code to halt execution at that line, then step forward line by line, watching values change as you do so.
