Memory Tracer Application
The Memory Tracer application can be used by Trihedral staff to analyze VTScada’s demand on computer memory. On rare occasions, technical support may ask you run this utility while diagnosing a problem. It is typically used to identify potential memory leaks. The Memory Tracer application must be loaded into the VAM before use.
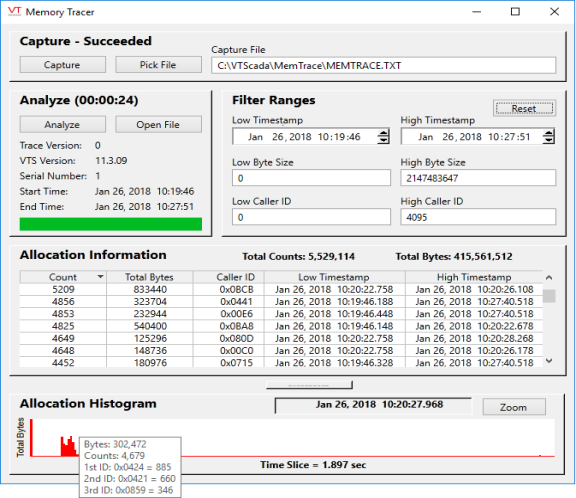
Sample memory trace
Using the Memory Tracer Utility
VTScada memory allocation calls are each given a unique ID. A memory leak or other problem would be indicated by an unusually high count or total byte value, or by an allocation histogram that is not mostly empty. By referencing the caller ID associated with a high count value or that shows up many times during the time slice, programmer's can quickly find the code that is responsible for allocating this memory.
To begin capturing the VTScada memory usage, click the Capture button. The button will read "Capturing" for several seconds while data is being saved to the specified text file.
By default, VTScada creates a default memory trace file in the format of an encrypted text file named, "MemTrace.txt", which is stored within the MemTrace subdirectory of the VTScada installation directory (e.g. C:\VTScada\MemTrace\MemTrace.txt)
You may use the Pick File button or the Capture File field to specify an alternate location or file name if you wish. Memory Trace files may be used to send a trace to another computer for analysis.
The Filter Ranges, are used to restrict the capture to:
- VTScada usage during a given time frame
- Low and high byte sizes
- Low and high caller ID values.
The Reset button in this area will restore the filter to the widest possible ranges.
Analyzing a Memory Trace File
After you’ve captured data to a memory trace file, or opened an existing file, you can analyze its data. To do so, simply click the Analyze button. When the progress bar reaches 100%, the Memory Tracer application’s elements will be populated with data. Click any column title to sort the table by that column.
For each Caller ID (identifying the line of VTScada code that allocated the memory) the following information will be displayed:
- The count of times that line was called.
- The total memory allocated by that code.
- The Caller ID.
- Timestamps, identifying the earliest and latest times that code identified by this ID allocated memory during the capture timeframe.
The histogram will normally display a large number of total bytes at the beginning of the time frame, with a few small byte allocations during the span. As you move the mouse across the graph, the date and time matching the cursor location will be displayed. Pausing the mouse over any blip in the histogram will cause a window to display showing the bytes allocated at that point in time, and the Caller ID's associated with code that allocated memory at that time.
Note that you can copy information from the Allocation Information table with a Control-C. This information can be pasted into any text file or spreadsheet. The copied information will not be sorted.
Viewing Smaller Segments of a Time Slice
Before using the Zoom button, drag the cursor over a section of the histogram to select a portion of the time span. If you click Zoom without selecting a region of the histogram, the result is unlikely to be useful.
There is no undo for the zoom command. Reopen the file and click the Analyze button to reset the histogram.
