Source Debugger

The Source Debugger is the most powerful and comprehensive of the VTScada debugging tools. You can monitor several applications simultaneously, each within a separate instance of the Source Debugger.
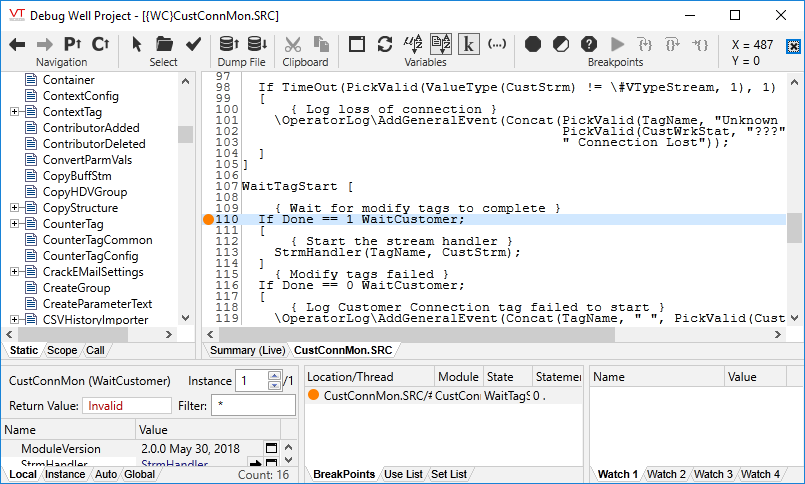
Image does not show the full toolbar
If the Source Debugger application is not visible in the VAM, you must manually add it. The Source Debugger application's directory is named "Source Debugger" and is stored within the VTScada installation directory.
Use the Source Debugger to:
- Examine the source code for the VTScada application you are debugging.
- Pause execution of VTScada script code by setting breakpoints.
- View the execution history of a specific thread when a breakpoint is "hot".
- View and modify variable values.
- Search for a specific instance of a module by specifying a Boolean expression.
- Locate module instances that use a specific variable in steady-state, and find the module instance that is setting a variable in steady-state.
- Build up to four watch-lists of selected variables that remain on view continuously.
- Create profiles of modules, documenting the number of execution counts and execution time used during a sampling period.
- Slay instances of modules.
In addition to the Source Debugger, VTScada includes an older application named "Debugger". While the older debugger can still be useful in certain situations, the Source Debugger is by far the more advanced of the two tools.
Select an application for debugging
There are several ways to select applications for debugging:
- Click the application’s name in the Applications section of the Summary (Live) Tab in the main window.
With this method you can select either running or stopped applications. Note that while you can examine the source code of a stopped application, you will not see modules or values as none are running.
--OR--
- Within a VTScada application, navigate to the page you want to examine.
- In the Source Debugger, click the Select Window to Debug.
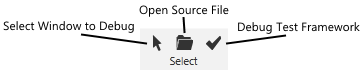
- Click on the appropriate window in your VTScada application. The Source Debugger will select the running module instance that contains the graphic statement under the mouse pointer as the current module instance, and will display the module trees, content list, and source code for that module window.
--OR--
The Source Debugger can examine a dump file in much the same way that it can examine a live system. To open a dump file for debugging:
- Click the Open Dump File tool in the toolbar.
The Open Dump File dialog will open. - Browse to and select the dump file you wish to analyze.
- Click the Open button.
The selected dump file will open in the code display window in its own separate tab labeled "Summary (Dump)".
You can also open any VTScada source code file for debugging by clicking the Open Source File button, then navigating to find and open the file. If the application is not running, no variables will be set and the module tree will not load.
