Historian Diagnostics
The Historian will log diagnostic messages upon startup. Following startup , diagnostic messages for the Trace Viewer will be logged only when errors occur. If neither of these conditions occur while you are capturing a trace, the display will be empty.
An empty list is to be taken as a sign that all is working properly, assuming that you have selected Historians for tracing.
You must select which historian's data to capture. When you first open the page, none will be selected by default. Click on the Select Historians Button.
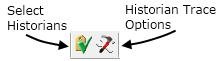
These buttons are visible only after you have selected Historian Trace from the Live Data Capture Selection dialog.
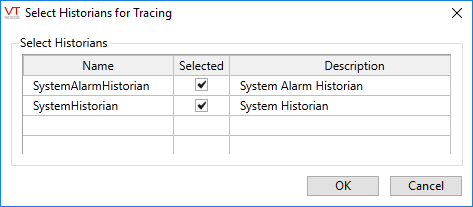
The Select Historians dialog will present a list of all Historians active in running applications. Choose one or more by clicking on the Selected check box.
An Historian trace will include the following information:
- Timestamp
- The name of the Historian tag
- The type of trace (debug or connection)
- The name of the tag whose data was being logged by the Historian
- An error code (of use only to Trihedral staff).
- The text of the error.
- A message describing the logged event.
The Trace Options dialog:
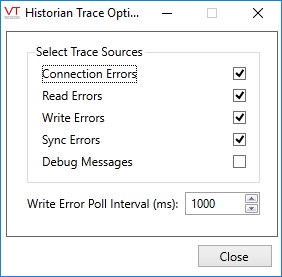
This dialog also contains a Write Poll Interval field, measured in milliseconds. You may adjust this value to change the frequency at which trace information is gathered.
