Trace Viewer Controls
A typical Trace Viewer display with data will look similar to the following:
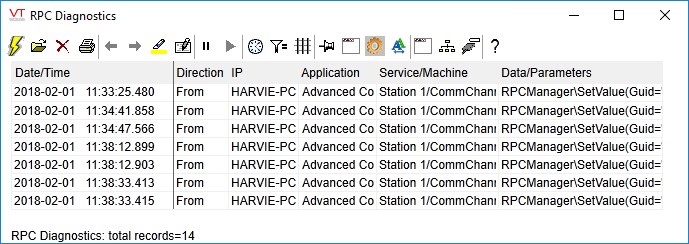
Note the row of control buttons across the top of the screen. Some vary according to the selected data source and are described in related topics within this chapter. Controls that are common to all data sources are described here or in the following topics:
Toggle the timestamp display 
The first column of the Trace Viewer’s list can be toggled to display one of three formats:
- Time: Displays the time to the nearest millisecond for each item in the list.
- Date/Time: Displays the date in the format MM/DD/YYYY and the time to the nearest millisecond for each item in the list.
- Record: Displays a record number for each item in the list. You might sometimes find that it is easier to navigate a sequentially numbered list than to look for time stamps that vary by milliseconds.
To switch between these options, select the Toggle Timestamp Display button. The column’s label and data will change to match.
Pause and run the live display 

You can pause and resume the display of live data in the Trace Viewer using the Pause Live Display and Resume Live Display buttons. Pausing the live data display gives you to take the time to examine records in the list, especially in large applications where tracing moves quickly. Pausing the live display does not stop tracing and logging from continuing.
Clear the current trace ![]()
To clear a current trace, select the Clear Current Trace button. The trace you are viewing will be cleared and all logged data will be deleted from the trace file being viewed.
Clearing a trace file is a permanent and irreversible action.
Print the Trace Viewer's data 
When printing from the Trace Viewer, you will have a chance to review and change the selected printer and options.
- Select the Print button. The Print dialog will open.
- Set the printing parameters as you require (i.e. select the printer, page range, number of copies, etc.).
- Select the Print button.
The recommended print layout for the Trace Viewer is landscape.
Highlight records  , Next and Previous
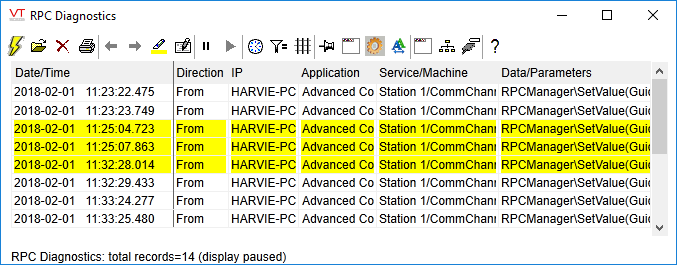
You can highlight records of interest in the trace viewer. As a typical example, you might be interested in records from a single tag in a list of many. As you locate each record of interest, you would highlight it. You can then navigate from one highlighted record to another using the Previous Mark and Next mark buttons. (Note that the navigation buttons are disabled while highlight tool is active.)
Highlighted records will appear similarly to the example shown. Note that performing this action causes the live display to pause. Data will still be logged, but you will need to resume the live display to see it.
To highlight records:
Select the Highlight Records button. The mouse cursor will appear as a highlight pen.
Select the records you wish to highlight. The records will be highlighted in yellow.
Select the Highlight Records button again to stop highlighting. The mouse cursor will revert to an arrow.
Highlights can be cleared individually by following the same procedure you used to set them. The highlight pen works as a toggle: select a record once to highlight it, then select the record a second time to remove the highlight. There is no "clear all" tool.
Keep the Trace Viewer on top 
To keep the Trace Viewer dialog on top of all other windows, select the On Top Of Other Windows button.
Hide and reveal the Trace Viewer's list 
When the Trace Viewer is pinned on top of other windows, it can obscure the view. You can shrink the Trace Viewer to just the toolbar, hiding and revealing the data display by using the Toggle Toolbar View button.

Within the settings dialog, you can modify the rate at which the display is updated from the server and the rate at which the rate is updated when running the Trace Viewer over an Internet connection. The default rate is one second for workstations (server) and five seconds for VIC connections.
The settings dialog can also be used to choose whether IP addresses should be translated to NetBIOS names (where possible).
Select the list font 
If you find that the data being displayed in the Trace Viewer’s list is difficult to read, you may change the font, font style and font size used to display list items.
Displaying version information 
You can find which version of the trace viewer you have installed by selecting the About button from the menu.
