Trace VTScada Actions Application
Use the Trace VTScada Actions application to monitor selected VTScada services (such as the RPC Manager and Modem Manager), and their actions (the Navigator or SQL calls), by saving pertinent data (such as the date and time they executed) to disk.
The Trace VTScada Actions application should not be confused with the Trace Viewer Application, which can be used to view trace information for your applications in real-time.
This application is included with every copy of VTScada, but you may need to add it to the VAM.
Service names that contain a child-tag delimiter will be shown with a forward-slash.
Data is written to a text file named, "VTSTrace.txt". Additionally, VTScada traces all actions to disk, storing the data in a separate text file named, "VTSTraceAll.txt". Both the VTSTraceAll.txt and VTSTrace.txt files are automatically written to the VTScada installation directory when you exit your application.
An example of the Trace VTScada Actions dialog:
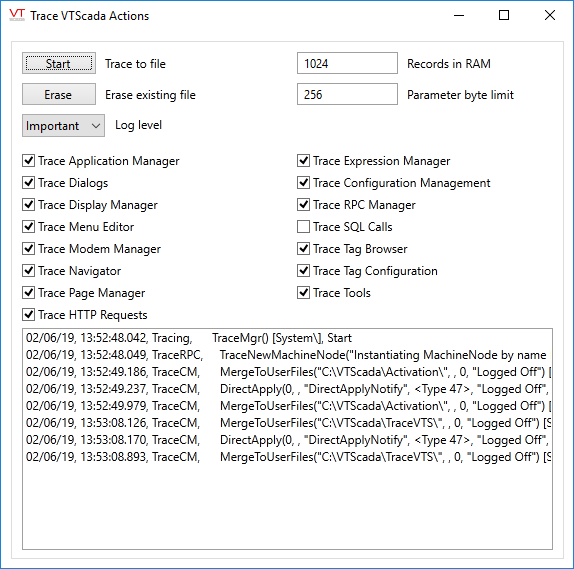
The Trace VTScada Actions utility consists of the following elements:
Start / Stop
Start and stop the tracing of the selected actions to a special text file named, "VTSTrace.txt" (located within your VTScada installation directory (e.g. C:\VTScada\VTSTrace.txt). When the button is toggled on (depressed and labeled "Stop"), VTScada is tracing the specified actions to file. When the button is toggled off (labeled "Start"), VTScada has stopped tracing the specified actions to file. As mentioned in the note above, by default, VTScada now traces all actions to a "VTSTraceAll.txt" file, located in your VTScada installation directory.
Erase
Deletes the tracing file (VTSTrace.txt) from disk when actions have been traced to file using the Start button. The Erase button is disabled while the Start button is selected.
Important / All
Selects the logging level. In most cases, the default, "Important", will suffice. Set to All only if the default level does not capture the necessary information, noting that the "All" level may capture an excessive number of irrelevant messages and degrade performance.
Records in RAM
Use to specify the number of trace actions you wish to be saved to RAM prior to being written to the VTSTrace.txt file. The default for Records in RAM is 256.
Parameter Byte Limit
Specify the maximum size of parameters. The default for Parameter Byte Limit is 256.
Trace Application Manager
Select whether all activities pertaining to the VAM are to be traced.
Trace Dialogs
Select whether all activities pertaining to dialogs are to be traced. This setting is useful if you wish to trace 4BtnDialog calls.
Trace Display Manager
Select whether to record all activities related to the Display Manager.
Trace Menu Editor
Select whether to trace all activities related to the Menu Editor.
Trace Modem Manager
Select whether to trace all activates related to the Modem Manager.
Trace Navigator
Select whether to trace all activities related to the shortcut menus in your application.
Trace Page Manager
Select whether to trace all activities related to the Page Manager.
Trace Expression Manager
Select whether to trace all calculations related to the Expression Manager.
Trace Remote Configuration
Select whether to trace all activities related to remote configuration.
Trace RPC Manager
Select whether to trace all activities related to the RPC manager and remote procedure calls.
Trace SQL Calls
Select whether to trace all SQL calls made in your application.
Trace Startup Synchronization
Select whether to trace all activities related to startup synchronization.
Trace Tag Browser
Select whether to trace all activities related to the Tag Browser.
Trace Tag Configuration
Select whether to trace all activities related to tag configuration.
Trace Tools
Obsolete as of VTScada release 11.
Each of the check boxes described above corresponds to a configuration variable in the system-wide Setup.ini file (stored in the VTScada installation directory). Information on these variables can be found in "Configuring Setup.ini".
Trace List
The list displayed on the Trace VTScada Actions dialog displays the actions that have been traced according to the check boxes you've selected. For each action traced in the list, the following data is displayed:
Date: The date for each action being traced is displayed in the first column of the trace list. The date is displayed using the format, "MM/DD/YY" (e.g. 10/24/05).
Time: The time at which each action was traced is displayed in the second column of the trace list. The time is displayed in milliseconds, using the format, "HH:MM:SS.MS" (e.g. 16:07:23.129).
Trace Action: The category of the action being traced is listed in the third column, according to the check boxes you have selected (e.g. TraceVAM or Trace RPC).
Data: The details about each action being traced are identified in the fourth column.
In the event that some items in the list are difficult to read, you can expand the Trace VTScada Actions dialog either using the Windows maximize button in its title bar, or by dragging its borders, or you can rest your mouse pointer over each entry in the list to view its details.
