Additional Columns in the Report Studio
If your query involves more than one tag or more than one calculation, additional columns will be created as required when the report runs, to a limit of 30 columns. You do not need to create a separate column for every tag and every calculation.
Very few reports will ever need a column C.
An example of why you might want a column C is if you are creating a report of flow rates and also need to track the matching pump run times. In column B you would create a tag query that includes the tag measuring flow rate and whatever related statistics you like. In column C you would create a tag query that includes the matching pump status tag and whatever statistics you wish to display for it.
Begin by clicking the [+] box to the right of column B to create column C. (You can add up to 30 tag query columns to a report but it is rare for any report to need a column C, let alone D.)
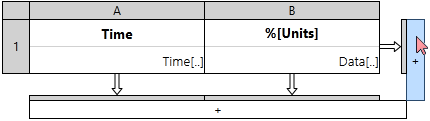
Adding a new data set column.
You will now have a new column, ready to display a new data set. Proceed as described in Tag Query Columns for the Report Studio.
