Create a Report Table
The Report Studio is still under development and has not officially been released. Be warned that code may change such that reports you create with this pre-release trial version might need to be updated in order to continue working after your next VTScada update.
Until the official release, documentation for the Report Studio will open in response to the F1 key but will not be shown in the menu system. To view a table of contents for the complete chapter, navigate to Report Building (Report Studio)
A table is used to display values in a report. A table is added to the report layout by dragging and dropping a table component onto the canvas and linking at least one cell to a Data Set. Up to 15 tables can be added to a single report. Within a table component, the final appearance of the table is also configured (colors, borders, alignment).
Here is a mock-up of a report that includes a table component:

This table displays a Time Data Set and a Tag Query Data Set.
A report can display values from one Data Set, or combine values from multiple Data Sets of any type. Some values can be calculated in the report using summary rows (for example, Average, displaying the average of all the entries in a column) or through the use of a Calculations Data Set.
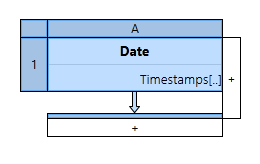
Add a table to your report by dragging a table component from the palette in the Report Studio. By default it will appear with a single cell (A1) linked to a time Data Set.
Clicking on different parts of the component will open different properties panels. Clicking a box with a + in it will add to the component.
Once a Table Component is dropped on the canvas, two Data Sets are auto-generated: Time and Row Labels. Timestamps are the default first column of a standard table because that is the most common configuration.
Why Row Labels? That is jumping ahead a little. Row Labels become the default first column for
Table Configuration Overview
The most basic table configuration includes a Time per Record (Default: 1 hour) and at least one Data Set (Default: Timestamps) . A more common and practical sequence may look like this:
- Set the time per record
- Format the table appearance
- Link Data Sets to cells in the table component
- Configure available table columns
- Add Summary rows (suppress as required)
- Preview and tweak
Begin configuring a table in the Table Properties panel.
Table Properties
Use Table Properties to
- Set the time per record
- Format the table appearance
- Enable Pivot Table or Transpose Table
Table Properties will appear on the right when a table component is dropped on the canvas. Reopen the Table Properties by clicking the top left corner of the component.

|
Trash Can (Delete component) Click the trash can next to Table Properties to delete the selected Table component. Set the frequency of new entries in the table. A shorter time will result in more rows for a given reporting period. Configure the Time per Record by duration (default), tag value or parameter. Pivot Table Convert to a Transpose Table Swap the rows and columns. Alignment Set the default alignment of table in the report layout. Left-justified, center, right-justified, stretch to fit.
|
Format Header, Body and Summary cells
The header, body and summary cells are configured separately.
- Grid box - click on any line to change cell borders.
- Alignment - Set text alignment. Left-justified, center, right-justified.
- Font- Set the font by selecting a Font tag.
- Color- Open color selectors to select the font color and cell fill.
- [ + ] - Click the plus to add alternating formatting.
Customize your fonts by configuring Font tags in the tag browser. Edit existing tags or add additional Font tags. Font tags are not counted towards your tag license limit.
See Font Tags for more information.
Add Zebra Striping to your table
Click the [+] to add alternating formatting to the body cells or summary cells. Duplicate font and color settings will appear on the properties panel. Report Studio will use each font/color combination sequentially row by row on a repeating basis. Two sets will create an alternating two-step pattern. Three sets will create a repeating three-step pattern and so on, up to five sets.

Reorder formatting using the arrow buttons. To remove a set, click the [ x ].
In a transpose table, alternate formatting is applied to columns instead of rows.
Data Cell Properties
To find Data Cell Properties, click on the cell, at the center of the table component (Cell A1). Use the Data Set droplist to select a Data Set or [ + ] to create a new one.
The number of columns and the values displayed in a report table depends on the selected Data Set and is refined by configuration.
The Data Cell will inherit the configuration of the selected Data Set by default. See the selected Available Data Fields and their configuration. You cannot make changes while "Use data set defaults" is enabled.
To change or reconfigure the available Data Fields, disable "Use data set defaults". The changes you make will apply to this Data Cell only. The parent Data Set will not be affected.
The Data Set types that can be represented in a table component include:
- Time
- Tag Query
- Alarm & Events
- Recipe Batches
- Notes
- Transaction Logger
- SQL Queries
- Calculations
For more detailed information about any Data Set type, see Create and Manage Data Sets
Add Multiple Data Sets to a Report Table
To add multiple Data Sets to a Report Table click the [ + ] on the right:

This will add an additional cell (B1, C1, D1...)
Each cell has a selected Data Set with additional available data columns.
