Report Building (Report Studio)
The Report Studio is still under development and has not officially been released. Be warned that code may change such that reports you create with this pre-release trial version might need to be updated in order to continue working after your next VTScada update.
Topics in this chapter:
Configure Time ColumnsSee Also
Create Reports for Recipe & Batch Management
Create Transaction Logger Reports
Calculations & Operations Columns
Report Studio Outputs and Formats
Introduction to Report Studio
Reports take data from your application and convert it into a format that highlights patterns, trends and irregularities. The Report Studio is a drag-and-drop environment for creating customized reports. Using the Report Studio, you can define a selection of reports to run by event, on a schedule or on demand.
Basic reports feature a table containing columns of values populated by timestamped rows. Values can be retrieved from tags, alarms & events logs, they may include custom report parameters, they can be calculated or queried-- just about any information that is accessible to your application can appear in a report.
The columns of a report are determined by a selection of Data Sets. Data Sets are available in several types, depending on what information you intend to retrieve.
In the simplest terms, to create a report in the Report Studio, drag and drop components onto your canvas to setup your report layout, link components to Data Sets and finalize the formatting of each component by adjusting component properties.
Reports can include a Line Chart. This takes its own Data Set and is not limited to the values that appear in a table in the same report.
Other decorative elements, such as images, parameterized text spacers, and containers give you a lot of control over the appearance of your report.
Users need privileges to access and use Report Studio.
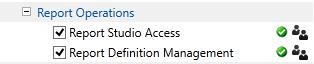
Report Studio Access
Allows the user to create ad-hoc reports. When the user launched report studio, they will be in [DRAFT] mode. They will have access to existing reports, can make temporary changes and generate an output using their temporary re-configuration, but they cannot save. When the user leaves Report Studio, they will be reminded that changes will be lost.
Report Definition Management
Allows the user to add, modify, save modifications or delete configured reports.
You can see the Report Studio Access and Report Definition Management privileges in the demo accounts, but
Reports and User Realms
If the application has realms, reports exist within the realm of the user who created it. Reports made by an administrator not assigned to a realm will be visible to all users.
Realms do not prevent users from seeing pages or widgets. But if a widget is linked to a report outside of a user's realm, it will be disabled for that user.
Finding the Report Studio
Open the Report Studio by clicking the Report Icon in the home ribbon.

or from the Reports Page, which is typically part of the Alarms, Reports & Diagnostics folder. If you haven't created a report yet, click Create New. Otherwise, select your Report Studio report from the drop list and click Edit Report.

Creating a new report from within the Reports page.
Report Studio opens to a draft page. Click the Home tab at the bottom to see the home page.
