Transpose Tables 
The Report Studio is still under development and has not officially been released. Be warned that code may change such that reports you create with this pre-release trial version might need to be updated in order to continue working after your next VTScada update.
Until the official release, documentation for the Report Studio will open in response to the F1 key but will not be shown in the menu system. To view a table of contents for the complete chapter, navigate to The Report Studio
Converting the default Table component to a transposed Table changes the table rows to columns and the columns to rows. Use a transposed Table for reports that have few rows and many columns. This configuration is suitable for reports with a few timestamps and many tags.
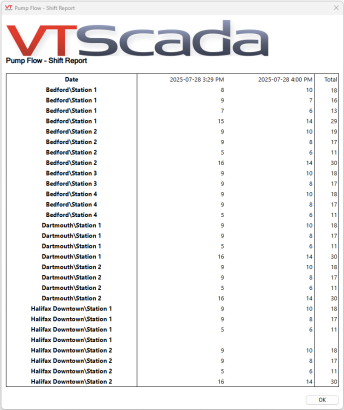
Here is an example of a report featuring a lot of pumps with just two timestamps using the default Table component:

The table has been cut off for display purposes. This table would not make a suitable .pdf or printed report.
Here is the same Data Set using a transposed Table:

We can now see all of the tags included in the tag query.
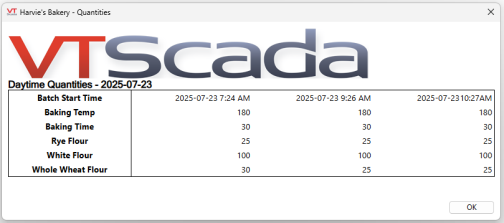
Transposed tables may also be used in batch processes where there are only a few batches and few or no additional steps but there are a large number of parameters such as ingredients:

Creating a Transposed Table
Drag a Table Component from the Pallet onto the Canvas and click the top left corner to open Table Properties. Convert the table to a Transposed table by checking the box next to "Transpose Table"

The Table component appearance changes when Transpose Table is enabled. Instead of appearing as a column, it now appears as a row.
Use the Preview button at the top of the Report Studio to see how your data is represented in this configuration and to assist in tweaking your configurations.
Click the + at the bottom of the Table component to add Data Sets or click the + to the right of the Table component to add column summaries.

It is possible to enable Pivot Table and Transpose Table at the same time. Enabling Pivot Table would display parent tag names as row labels and child tag names as column labels. Enabling Transpose Table would then cause the parent tag names to appear as column labels and the child tag names to appear as row labels.
