Pivot Tables 
The Report Studio is still under development and has not officially been released. Be warned that code may change such that reports you create with this pre-release trial version might need to be updated in order to continue working after your next VTScada update.
Until the official release, documentation for the Report Studio will open in response to the F1 key but will not be shown in the menu system. To view a table of contents for the complete chapter, navigate to Report Building (Report Studio)
Create a report table that displays parent names as row labels and child tag names as column labels. This comes in handy when displaying information for a large number of tags that have a common taxonomy and common names such as multiple pump device tags nested under a number of station tags.

Notice that Station 3 only has two pumps and Station 4 only has three. Therefore some cells are left blank on the table.
Creating a Pivot Table
Drag a table component onto the canvas. In the Table Properties panel, enable the setting labeled "Pivot Table". Your table is now a pivot table.
The default table cell, A1, will no longer display "Date" and the type will change to "Row Labels". The row labels will represent a parent tag name, and the column labels will represent child tags with a shared naming convention.
A Transpose Table flips the orientation of columns and rows. It is possible to enable Pivot Table and Transpose Table at the same time. Enabling Pivot Table would display parent tag names as row labels and child tag names as column labels. Enabling Transpose Table would then cause the parent tag names to appear as column labels and the child tag names to appear as row labels.
Create a Data Set for a Pivot Table
Pivot Tables are intended for use with a Tag Query type Data Set and may be enhanced with Calculation Data Sets. There are a few special considerations for configuring a Tag Query Data Set for a Pivot Table:
Using Queries and Wildcards to select tags
The key to easily scalable and complete reports featuring common, sequential groupings is using a strategic query. Instead of filtering and adding tags one at a time, you can type a query in a filter field and 'Add Query' to include all tags that meet the query criteria. For groups of tags, where each layer of the tag tree features the same name denoted with a sequential number or letter, using a query is a time-saver that will also capture changes to your tag tree. Take the following example:
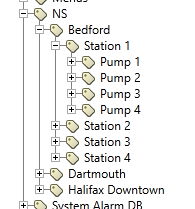
Unseen are all the IO tags nested under each pump.
If you were to expand this tag tree fully, you would see common IO tags nested under sequentially named pumps, nested under sequentially named stations, nested under a jurisdiction, nested under one common context tag. Every pump in this example has a status tag with the shortname "Running". To create the Bedford Pumping Stations Start Report displayed above, I selected NS\Bedford as my context tag and used the following query in the tag selector:
Station ?\Pump ?\Running
The wildcard * (star or asterisk) is a placeholder for any number of alternative characters.
The wildcard ? (question mark) is a placeholder for a single character. If you had tags running into the double digits, you might have to add a second query using "??" instead.
This configuration captures all of the status tags named Running nested under any numbered pump, from all of my numbered stations nested under my selected context tag.
There are three parameterized phrases that are especially relevant for configuring Pivot Tables:
%[AncestorShortName]
This parameter takes just a shortname from the tag name, specified by level.
In the provided example, the full tag name of the top-most entry is NS\Bedford\Station 1\Pump 1\Running.
The Data Column header parameter is %[AncestorShortName] %[DataColumn] with the AncestorShortName level set to the default 1. One step up in the tag name is "Pump 1", and next to this the selected Data Column.
The Row Label parameter is %[AncestorShortName] with the level set to 2. Two steps removed in the tag name is "Station 1".
%[AncestorRelativeName]
This parameter displays a portion of the full tag name from a specified ancestor level up to, but not including, the selected as the context of the query.
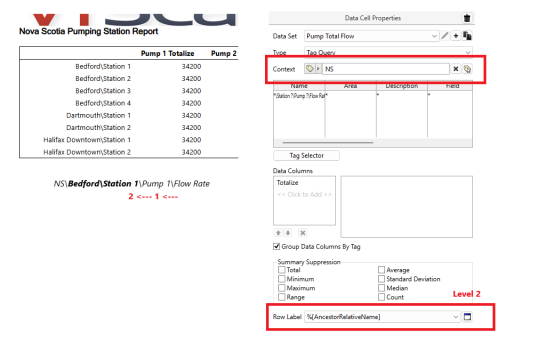
In the provided example, the full tag name of the top-most entry is NS\Bedford\Station 1\Pump 1\Flow Rate. The specified level is 2 and the selected context tag is NS.
%[AncestorDescription]
The configured description of an ancestor tag specified by level. This is the description from the tag properties ID tab.
