Plot Trends From the Tag Browser
To plot from the Tag Browser:
- Select one or more tags.
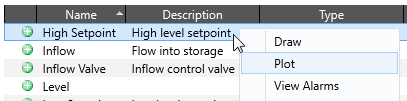
- Right-click on one of the selected tags in the list.
A context menu opens. - Click, Plot.
The HDV page opens as a pop-up window, showing the trend plot of the selected tags.
- The plot entry is disabled.
The selected tag cannot be plotted in the HDV.
Your account does not have permission to view the Historical Data Viewer page.
