Historical Data Viewer (HDV)
At a glance:
For operators, topics in this section describe how to create and adjust trend graphs using the Historical Data Viewer.
Find this in VTScada:
Left-click on a widget or...
Navigate to the Alarms Reports and Diagnostics folder.
Related topics and things to know before reading this include:
Find and Open Pages Within an Application
Where to go from here:
View a trend of a tag's values over time. Visit the Historical Data Viewer page or open an HDV pop-up by left-clicking a widget linked to a tag. Clicking additional linked widgets will add to the same HDV pop-up. Use the Tag Selection tools to create and save groups of tags and set a Time Span that is relevant to your tag selection. If you want the ability to add notes, you must include a Notebook tag with your plotted tag group.
Notebooks that have the same Area as the tag you select on screen will be included.
You can control this by changing the properties IncludeAreaNotesWithTrendedTags, and IncludeGroupNotesWithTrendedTags.
If using the Tag Selector tool within the HDV, only notebooks that you add will be included.
You can also use the following options to open or view the HDV:
- Draw a button or hotbox that will open a pre-configured HDV as a pop-up dialog.
- Draw a miniature HDV on any page, configured as required.
The point of the Historical Data Viewer is to convert recorded values into a sight-friendly format. Plotting out values makes patterns that are immediately apparent to an operator. Trends over time, irregular behavior, relative behavior between devices and other patterns that are not immediately apparent from a table of numbers can be grasped instantly when plotted out. With this in mind, it is important to note that the values displayed for a given point in the HDV are calculated values. Typically an average for a given span of time, extrapolated from last known values that are within a set tolerance, or interpolated (for analog devices, following the slope between two known values.)

Clicking a numeric display widget linked to an analog "Inflow" tag to open the HDV as a pop-up.
Worry not! Your precision logged values are still safe. Averages, extrapolations and interpolations are only used strictly for display purposes. The source values-- the real data-- remains unaffected.
Time per Point (TPP) Values and the Time Span
Broad graduations are displayed on the y-axis and x-axis for your estimation. The graduations along the x-axis represent increments of your selected Time Span. Unseen, VTScada has internally sliced the time span into about 300 to 1200 incremental 'points' and the values displayed at each point, as your drag your cursor across the plotted field, is representative of the average value during that sliver of time.
Why is it done this way?
For the Historical Data Viewer, VTScada is prioritizing readability and a plotted line that is as close as possible to its real-world analog. If you are viewing a week's history for a tag that is logged every 10 seconds, there are 60480 records in the log file for the week. It would be impractical and impossible to accurately represent 60480 points of real data along an x-axis that can fit on the average monitor. And so, the data is pooled and an average is given as the value for the time per point.
Conversely, in some VTScada configurations it is completely expected and acceptable for multiple points of time to pass before recording a new confirmed actual value. For digital tags, as long as all indications show an otherwise healthy and active connection, the last known value is repeated in the HDV for each point until new information becomes available. For analog tags, this begins in the same way but when a new value is given that indicates a change, the HDV will re-draw the plotted line to represent an analog slope from one confirmed value to the next. This is an interpolated value, and it is far more reflective of how analog changes occur in real time. Tanks fill, temperatures change, motors accelerate, and pH drops gradually, along a slope. Not in right-angled steps.
An exception is made for Analog tags that have been reading a value of 0 and suddenly register a non-zero value.
How much time does a point represent?
VTScada uses an internal calculation to determine the TPP period depending on your selected Time Span.
| Selected Time Span | TPP period in seconds |
| 1 second (The smallest available selection) | 0.001 |
| 30 seconds | 0.05 |
| 1 minute | 0.1 |
| 10 minutes | 1.0 |
| 30 minutes | 2.0 |
| 1 hour | 5.0 |
| 6 hours | 30 |
| 12 hours | 60 (1 minute) |
| 1 Day | 120 (2 minutes) |
| 1 Week | 900 (15 minutes) |
| 4 Weeks (About a month) | 3600 (1 hour) |
| 120 Days (About a quarter) | 14,400 (4 hours) |
| 1 year | 43,200 (12 hours) |
| 5 years (The largest available selection) | 432,000 (5 days) |
If the tag is being logged, the graph can be scrolled to show historical information. If there is no saved data, then the graph will show only new values as they are being collected. The HDV makes it clear whether the plot is of live (current) or of historical values. While you are viewing live data, the pause button (following image) will look like any other button. While you are viewing only historical data, the button will be an arrow on a yellow background. Ctrl + 0 or Ctrl + * will also resume live mode if the HDV is paused.
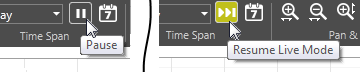
Controls to pause and resume live data display
The pen legend, across the lower edge of the window, provides a color-key to the plot lines, value statistics for the time span shown and controls to hide a plot line or change its display characteristics. The statistics shown are defined as follows:
- Value - A calculated value. Hover over a plot line (or select a point) and see a value that is representative of the TPP.
- Minimum - The smallest value recorded during the selected Time Span.
- Maximum - The largest value recorded during the selected Time Span.
- Average - The average of all values for a selected Time Span.
Some of the features and settings available in the HDV require you to select a pen from the pen legend. To access a Pen Properties dialog, double-click a pen or click the cog wheel icon.
Analog Pens: Averages and Peaks
- If the Plot Averages option is enabled, then averages will be plotted. If the Plot Peaks option is selected, then the minimum and the maximum values will be plotted, resulting in a banded plot. You can choose to plot Peaks and Averages at the same time. If neither is selected, no plot line will appear.
- You can control the default scale range for analog pens. The scale can be set in the tag configuration, within the pen properties, or allowed to float, automatically adjusting to the currently displayed values.
- In the legend, "Average" refers to the percentage of the displayed time for which the tag was in state 1 ("On"), expressed as a decimal value.
- In the grid view, when viewing averages over a time span that is greater than the logging rate, a % active value will show you what percentage of the logged values within that time span had a value of 1.
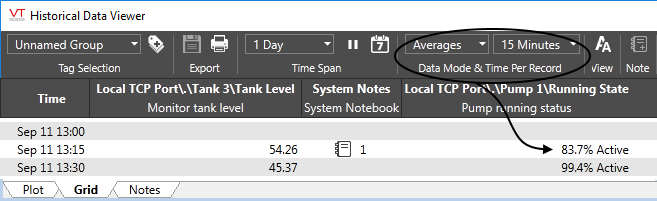
To view the history of actual on and off cycles, select the Raw Data option from the menu.
Daylight Savings Time vs. the HDV
Dealing with Daylight Savings Time:
VTScada records all data using UTC timestamps. In UTC, time advances at the rate of one second per second (barring leap-seconds) and if you were to plot your data against UTC time, you would see an uninterrupted line, assuming that your system is up and running, logging data.
Complications arise in places where daylight savings time (DST) is used. When DST starts in the spring, clocks jump forward from 2:00:00am to 3:00:00am. As far as UTC is concerned, data continues to be logged at the same rate, but if viewed on a graph that shows the local time, there will be a gap or a straight line showing no data for that hour. This is not a problem with VTScada. The gap exists because no time passed when the clock jumped forward, and therefore there is no data for that hour. Nothing can be shown.
Also, that day is 23 hours long, not 24, which may affect your reports. Again, this is not a problem with VTScada. According to your local clock, the DST-transition day had only 23 hours, therefore a daily report can include only 23 hours worth of data.
In the autumn, when daylight savings time ends, you can expect the same in reverse. It will appear that an hour's worth of data is over-written during the transition as the local clocks repeat that hour. That day is 25 hours long.
Rest assured that VTScada is faithfully and steadily recording your data, regardless of what your local clocks are doing.
Keyboard Shortcuts for the HDV
| Key Combo | Description |
|---|---|
| Arrow Keys (Left/Right) | Pan backwards and forwards in time. |
| Shift + Arrow Keys (Left/Right) | Pan backwards and forwards in time in larger increments. |
| Ctrl + Minus sign (-) | Zoom out (x-axis). |
| Ctrl + Plus sign (+) | Zoom in (x-axis). |
| Ctrl + 0 or Ctrl + * |
Return to live mode. |
| Esc | Exit selection choice in 'Pan & Zoom' |
- Values are rounded to the nearest 1.
The I/O tag is configured for 0 decimal points. Open the tag's properties dialog and select the Display tab. Increase the decimal points to the value you want.
- Unable to see plotted values in the graph.
Check pen configuration. Ensure that at least one of "Plot Peaks" or "Plot Averages" is selected. If neither option is selected, nothing will be plotted. Confirm that the pen color, style and width will plot a line that is easy to see.
Check that there are values for the selected pens. If all values are a flat line at the top or bottom of the range, they may not be easily visible. If the tags are not logged, it may be necessary to reduce the time scale to see live values being plotted.
If security groups and realm-area filtering are configured, you may not have the right to view the selected pens.
Developers can configure tags and widgets so that the HDV does not open in response to a click. This many have been done for selected tags and widgets in your application.
- The Historical Data Viewer doesn't open.
The developer may have disabled the trends feature for this tag. Check with your supervisor.
The item you clicked upon is not an input tag.
The ability to see the HDV is controlled by a security privilege that you may not have.
The HDV is already open but moved off to the side of the screen.
- Another window opened in addition to the HDV, perhaps blocking your view.
Every object in the location where you click, will respond - not just the top-most tag. - Ask your developer to adjust the screen layout or use the full Historical Data Viewer window rather than clicking on this tag.
