Well Plot Widget
This widget is a part of one of the automatically-built station pages. While it can be added to a user-created page, that is not it's intended purpose.
Used by: Grundfos Control MPC, Grundfos Dedicated Controls, MPE Duplexer Station, MPE SC Station, MultiSmart Station
You can create your own version of this widget, which will work with your custom tag types, by following the directions in the topic Build a Station Widget.
The Well Plot widget is used to a 24-hour trend of levels within a station's well. The content and appearance will vary according to the linked tag and the configuration of that tag.
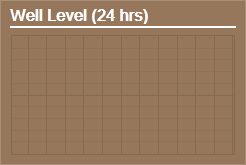
The properties dialog for the Well Plot Widget
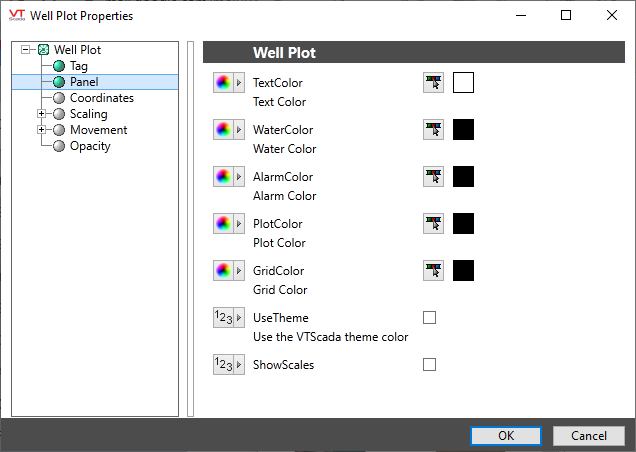
Text Color
Sets the color for labels and information within the widget. Defaults to white for visibility against a dark gray background.
Water Color
Sets the color that will represent water.
Alarm Color
Sets the color with which the alarm setpoint line will be drawn.
Plot Color
Sets the color used for the plot line.
Grid Color
Sets the color used for the background grid.
Use Theme
If selected, the overall appearance of the widget will follow the applications color theme. Dark gray otherwise.
Show Scales
If selected, scaling values will be shown along the side of the graph.
Equipment\Lift Stations\
Tag Types\Pump Station Controllers\MPE\MPE Duplexer Station\
Tag Types\Pump Station Controllers\MPE\MPE SC Station\
Tag Types\Pump Station Controllers\Multitrode\MultiSmart Station\
Tag Types\Pump Station Controllers\Grundfos\Grundfos Dedicated Controls\
