
Used by: All driver tags, All analog tags, Alarm Status, Calculation, Comm Link Sequencer, Counter, Deadband Control, All digital tags, Function, History Statistics, Modem, Pump Status, Rate of Change, Script, Selector Switch, Serial Port, Totalizer, SQL Logger.
* Does not use the Style Settings tag.
The Plot Data tag widget is used to plot the value of the tag being drawn on a graph similar to that displayed on the Historical Data Viewer page. Drag the plot to the right to see earlier data that is no longer visible. Drag the plot all the way to the left to resume the live trend.
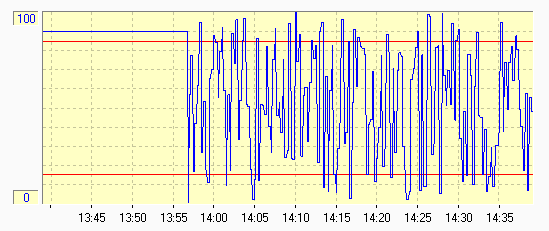
Tags drawn using the Plot Data widget must be logged, either by an attached Historian or Logger.
The properties dialog for the Numeric Entry widget:
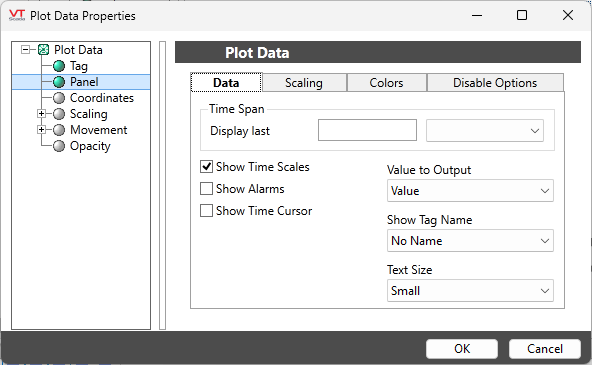
Time Span
The Display Last field and drop-down list are used to configure the time span to display in the completed Plot Data object.
You may select Minutes, Hours, or Days from the drop-down list, and enter a corresponding number in the field to its left.
Display Time Labels
Select this option if you wish to display incremental units of time along the bottom of the completed Plot Data object.
Show Alarms
Select this option if you wish to display the alarm setpoints (if any), that associated with the tag being drawn on the completed Plot Data object. Alarm setpoints will be drawn as horizontal lines at the values matching the setpoints. This check box will not be enabled if the tag has no associated alarms.
Value To Output
Select which value associated with the tag, should be plotted. For the majority of tags, there will only be one default option, "Value", indicating the value of the tag.
Show Tag Name
Defaults to "No Name". Select either of "Short Name" or "Full Name" to add the tag's name to the marker line when the user examines values across the plot.
Text Size
Choose between five sizes of font for the scale labels. Sizes range from small to extra large where each size is two points larger than the last.
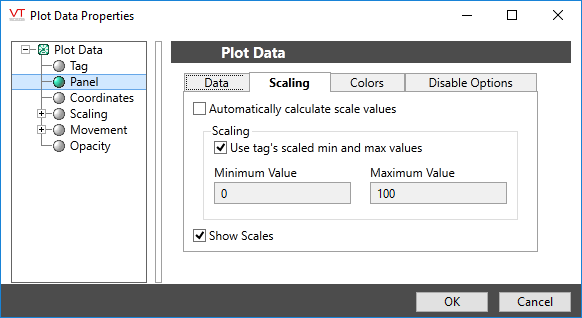
Use Tag's Scaled Min and Max Values
Selected this option if you wish to use the Scaled Process Data Min and Scaled Process Data Max properties configured for the tag being drawn. This will be the most common case.
If plotting a tag such as a Calculation, that does not have scaled process values, you can deselect this box to provide the minimum and maximum values expected.
Minimum Value and Maximum Value
These fields adjust the minimum and maximum values shown on the graph’s vertical axis. They have no effect on the tag’s value, which is what will be plotted.
Show Scales
Select if you wish the minimum and maximum scaling values to display to the left of the completed Plot Data object. Without these values displayed, it can be difficult to judge the meaning of the plotted data.
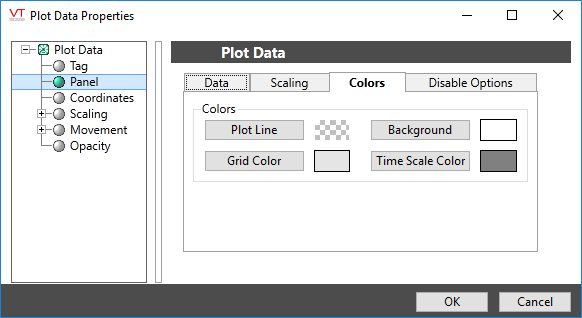
Plot Line
Opens the Select Color dialog from which you can select the color with which this tag's data will be plotted on the completed object. You should select a color that provides a good contrast from the background.
If this widget is linked to an I/O and Calculations tag that has a set color, and no override is set here, it will use the color from that tag.
Grid Color
Opens the Select Color dialog from which you can select the color with which the grid will be drawn on the completed object. You should select a color that provides only a slight contrast from the background so as to not obscure the plot line.
Background
Opens the Select Color dialog from which you can select the background color with which the Plot Data will be drawn.
Time Scale Color
Opens the Select Color dialog from which you can select the color for the numeric scale. A choice that provides a clear contrast from the background will help operators read the numbers.
Disable Options
Disable selected operator-interaction features of this widget.
See: Operator Interaction Controls
Analytics\Trends & Historical Data\
