The Alarm Page
At a glance:
For Operators and Developers. This provides an overview of the features on the Alarm Page.
Find this in VTScada:
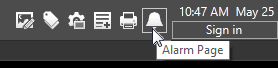 Open the Alarm page by clicking the alarm icon at the top of the screen, or through the menu system. A right-click on any menu link will open the page as a secondary or pop-up window. Other navigation tools can be configured.
A security privilege restricts access to the Alarm Page.
Related topics and things to know before reading this include:
Find and Open Pages Within an Application
Where to go from here:
Every VTScada application has an Alarm Page, where you can view alarms, events, and Alarm Manager transactions. What operators can do with that page depends on the security privileges granted to their account.
In addition to the standard Alarm Page, many developers create a customized Alarm List on various pages. These lists can have some or all of the features of the one found on the Alarm Page and may be filtered to match the other contents of the page.
If you have applied Global Tag & Area Filtering, you will see only alarms that pass the filter. A warning is provided, as shown. Alternatively, you can configure the list to ignore Global Tag and Area Filters.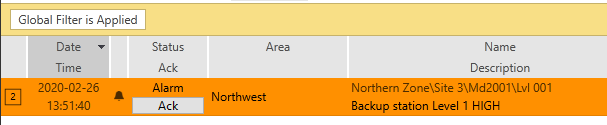
Key Terms:
Alarm:
A notification that an operating condition has exceeded a design limitation. An operator must take action to acknowledge the alarm and to fix the problem. The priority of the alarm indicates the urgency of action.
Event:
A record that something has occurred. No acknowledgment or action is required. An event is recorded for every time that you sign in, sign out, and send a control action to equipment using the SCADA system. Other events may have been created for your application.
Transaction:
Any entry in the alarm or event database. Includes configuration and state changes as well as alarms and events. A single alarm may have many transactions as it activates, is acknowledged, then returns to normal as correct operating conditions are restored.
Applications can be configured so that when an alarm occurs, a page showing the matching tag will open automatically. In effect, the Go To Page feature of the alarm list can be made to happen automatically after short delay.
Open the Alarm page by clicking the alarm icon at the top of the screen, or through the menu system. A right-click on any menu link will open the page as a secondary or pop-up window. Other navigation tools can be configured.
You can choose to view alarms from all databases, or from only one at a time.
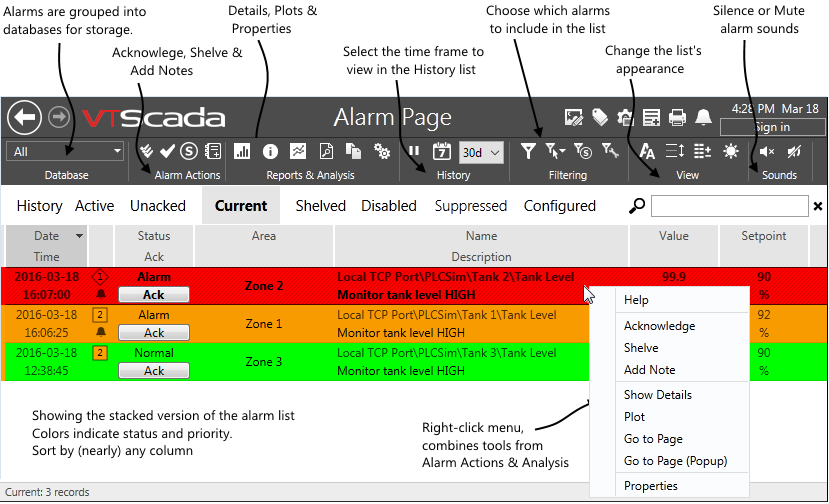
Highlights from the VTScada Alarm page. Appearance may vary.
Alarm lists can be configured. Yours may not match this image.
The list can be filtered and sorted as needed. Alarms may be acknowledged using the buttons in the Alarm Actions section of the ribbon, but in most cases, it will be easier to use the button provided within the list for each alarm. A right-click on any alarm opens a context menu of controls. In particular, you may find the Plot and the Go To Page entries to be especially useful.
Alarm actions
The following actions are available to deal with alarms. Note that "Suppress" is not included here. Alarms are suppressed when a configured expression is TRUE and unsuppressed when that expression is FALSE.
Change font sizes
Choose between five sizes of font for text used in the list and the column labels. Sizes range from small to extra large where each size is two points larger than the last.
Alarm Reports from the Alarm Page
Click Alarm Reports to open an Alarm Reports dialog.
Use the filters to display the records that you want to include in a report and print or copy the list to Windows clipboard for use elsewhere. Clicking on a specific entry will enable other analysis tools such as Show Details, Plot and Go to Page. Using this copy and paste method from the Alarm Report dialog is a quick and easy way to pull info from your application to include in reports in other applications.
Use the Report Studio for more report options and features. Use an Alarm and Events Data Set with a table component (Create Alarm & Event Queries). Configure a report once and then run the report on demand, by schedule or triggered by an event. Using this method, you may combine Alarm and Event information with other context-rich components like line charts or tables of information queried from tags.
