Debugger Utility
There are two similarly named utilities: "Debugger" and "Source Debugger". This topic refers to the older and less powerful of the two, the Debugger.
If you are new to VTScada and looking for a debugging utility, you should turn first to the Source Debugger
The Debugger utility can be used to examine the contents of modules and their properties and can be helpful in helping you to locate problems that happen only while your application is running. The information displayed in the Debugger is updated in real-time as the scripting code runs. This is an older technology than the Source Debugger, but some find that it is still useful.
The Debugger application is not listed in the VAM by default, therefore you must add it. The Debugger application's directory is named "Debugger".
Pressing the keys "Ctrl-D" in the VAM will launch the Debugger.
An example of the Debugger:
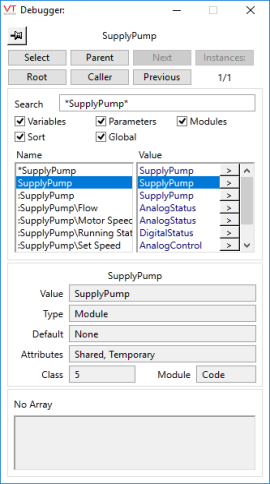
Examining the SupplyPump tag in the Completed Tutorial
The top of the Debugger displays the name of the module being examined and the name of the current active state, in parentheses following the module name.
Pin button
 (pin / currently pinned)
Use this button to choose whether the Debugger window should remain on top of all other windows.
Select button
Use this to choose which graphics module to examine.
- Click the Select button.
- Click on a VTScada page to begin examining the variables in the graphics module for that page.
Parent button
After selecting a graphics module, use the Parent button to examine the parent of the current module.
Next button and Previous button
Step forward and backward through the history of modules you've recently viewed.
Instances button
The Instances button enables you to step through the different instances of the module if more than one is running. The current instance and the total number of instances are shown beneath the button.
Root button
Used to quickly select the root module of the current module.
For example, if you are interested in examining a tag that is drawn on a page, you would first use the Select button to choose the page, then the Root button to move up the module tree. The display would then include (among other things) all of the tags in the application, from which you could select the tag you are interested in.
Caller button
Use this to examine the caller of the current module.
Search field
Use by entering a search string by which you wish the list of variables to be restricted. The wildcard characters '?' and '*' may be used in combination with either a single character or 0 or more characters to locate specific variables. You can use the asterisk wildcard to stand for any combination of characters. For example, L* will return all variable names that begin with the letter "L", *L or *L* will return all variable names that contain an "L" anywhere in the body of their name.
Pressing the key combination, "Alt-Home" will perform the same function as clicking on the Root button.
Variables check box
Filters the list to include variables when selected.
Parameters check box
Filters the list to include parameters when selected.
Modules check box
Filters the list to include modules when selected.
Sort check box
Filters the list alphabetically when selected. If deselected, the items displayed in the list will appear in the order in which they were declared.
Global check box
Filters the list to include all variables that can be accessed from the current module. Otherwise, only the variables in the current module will be displayed.
When a new value is entered in the edit fields in the debugger, the Enter key must be pressed or it will not "register" (i.e. changing focus does not automatically enter values into the fields of the debugger). Further, if a text string is greater than 255 characters, only the first 255 characters are shown in the value field, but its full length is still registered.
Beneath the filtering and sorting check boxes appears the list of modules, variables and parameters. This list may be resized by dragging the divider between the Name and Value columns. If an item in the list is a module, an expand module button ">" will appear to the right of its "Value" column.
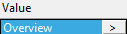
By clicking on this button you can expand the module and examine its contents.
Under the list of modules, variables and parameters is information about the items in the list. (example shows the list for an Analog Input tag with the UnscaledMax parameter selected)
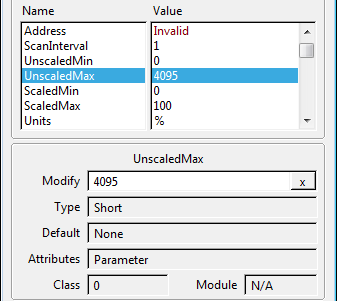
Clicking on any item in the list of modules, variables and parameters will bring up information on the selected item, such as the value of the selected item, the data type (if the selected item is a variable), the attributes of the selected item, the class of the item, and if the selected item is a variable and the "Global" check box is selected, the module to which the variable belongs will be displayed. The name of the selected module, variable or parameter is centered above the Value field.
In the event that a selected variable has a value that can be modified, the Value field becomes enabled for modification, and includes a "clear value" button, which is marked with an "X". Any changes you make to the value of a selected variable will have an immediate effect in the running instance of the current module. Clicking on the clear value button will invalidate the current value.
If the selected variable is an array, the information displayed applies to the current element of the array only. The array contents are visible in the Array field at the bottom of the Debugger.
In the array display area, there is a scrollable listbox that contains a list of elements for the selected dimension. The current dimension can be changed at the top of this area. Selecting an element in this listbox will allow information on the element to display/edited in the variable information area.
