Historian Tag Activity Report Tool
This tool is only available on Historian servers and not available from a thin client such as the VIC or anywhere client.
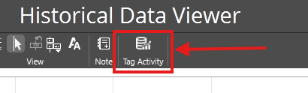
The Historian Tag Activity report helps you to identify tags that are logging frequently. Analyze one Historian at a time. Select your preferred time span and click Start. The tool will display the top 100 most frequently logging tags from the selected historian over the selected time span. These records are displayed in a sortable grid list.
Select a record to display a bar graph in the right pane. The graph details the frequency of logging over a given time span. This may provide important context by comparing surges and lapses in logging to real-world and possibly re-occuring events that coincide with the time line.
Select an Alarm Historian to analyze the frequency of logged alarms and events. For more information about your alarm configuration, see: Alarm Reports & Analysis
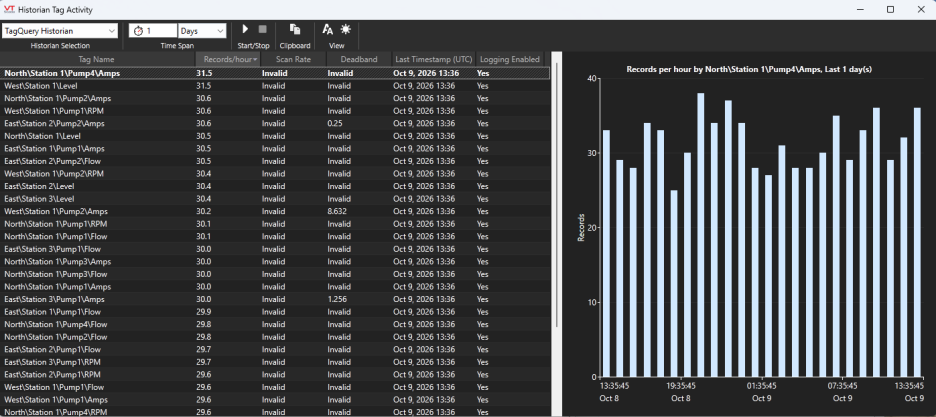
The provided example was taken in dark mode.
The results given by the Historian Tag Activity Report Tool are essentially an internal report. Copy the list to your Windows clipboard and paste it into a document, spreadsheet or any other compatible program.
Historian Tag Activity Ribbon

Historian Selection
Click on the drop list to select a Historian. The two default Historians are SystemHistorian (logs I/O tag values) and SystemAlarmHistorian (logs alarms and events).
Time Span
A numeric field and a time unit. The report runs for the time span ending when you click start and spanning back the length of selected time.
Select Days, Weeks, Months, Quarters or Years.
Start/Stop
Click Start to start processing a report. During the course of processing, a progress bar will be displayed and the Stop button will be enabled. Click stop to halt the process.
Clipboard
Click the clipboard icon to copy the grid list to Windows clip board in a CSV format.
View
Click the font icon to toggle through different font sizes.
Click the sun icon to toggle between light and dark mode.
Historian Tag Activity Data Fields
Click any of the headers to sort the grid list by any category. Click again to switch from 'from highest' to 'from lowest'. Hover between headers and the cursor will change to a double arrow. Click and drag to resize the width of the columns.
Click any row to select a tag and display more information in the right pane.
Right-click any row and select Properties to open the config folder of that tag.
Tag Name
The full name of the tag.
Tag name may be displayed shortened if the column isn't wide enough to display the full name. The full name will always be copied to clipboard no matter how it is displayed here.
Records/hour
The average number of records logged per hour for the given tag over the selected time span.
Scan Rate
The scan rate of the selected tag. Scan rate is the frequency, measured in seconds, at which the tag is scanned for new data. The scan rate for the Historian may be different than the scan rate for the system. This is determined by the configuration of the I/O tag.
Alarm tags do not have their own scan rate setting. For Alarms, the scan rate is determined by the tag specified in its Triggered By property and any configured On Delay of the Alarm tag.
This value should be as high as can be tolerated.
Deadband
The deadband of the selected tag. The deadband represents the minimum change in a tag's value required before a new value is written to the Historian and the value is a percentage of either the display range of the I/O tag (or the scaled range if no display range is set). The deadband is determined by the configuration of the I/O tag.
This value should be as high as can be tolerated.
Last Timestamp (UTC)
The date and time that data was last logged to the historian.
Logging Enabled
Indicates if logging is enabled in the selected tag at the time the report is run.
