Design your Report Layout
The Report Studio is still under development and has not officially been released. Be warned that code may change such that reports you create with this pre-release trial version might need to be updated in order to continue working after your next VTScada update.
Until the official release, documentation for the Report Studio will open in response to the F1 key but will not be shown in the menu system. To view a table of contents for the complete chapter, navigate to Report Building (Report Studio)
Unlike in Idea Studio where what-you-see-is-what-you-get, Report Studio requires you to stage the layout of your report first with the option to preview it and the option to test your report in a variety of formats before finalizing.

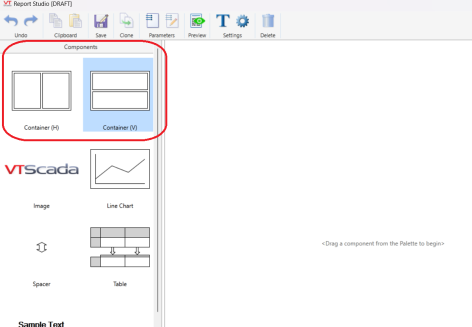
Stage your layout by dragging components onto your canvas, configuring and formatting your components and checking your progress using the preview button in the home ribbon.
Report Studio components include:
- Table
- Line Chart
- Image
- Text
- Spacer
- Containers
For a deep dive on Tables see Create a Report Table and to learn more about Line Charts see Add Line Charts to Reports
Default limit per report: 30
The VTScada logo is provided as a placeholder and sample image, the actual image is easily replaced by another. Drag the image component to the report, then use the Image Properties panel to select an image file, see the size in pixels and optionally resize, and choose the alignment of the image in the Report layout. Click the [...] button to the right of Image File to open an Image Selector dialog.
This is the same Image Selector that is used in Idea Studio.
Images must be part of your application before they can be included in the report. To import a new image into your application, click the + button at the bottom left of the Select Image dialog. Refer to Import Images.

The Report Studio Image Properties panel
Default limit per report: 30
Use text to give your report a title or to add relevant notes between other elements.
Drag the Sample Text to your report and edit to suit using the Text Properties panel. You cannot include line breaks in your text, but long text will flow over multiple lines as required when the report is built for PDF or HTML.

The Report Studio Text Properties panel
Note the tool for creating a parameterized phrase (circled in the preceding image). Instructions for this tool are provided in Parameterized Phrases.
When building a parameterized phrase, you can include any text in addition to selected parameters. Be sure to leave spaces to ensure that words do not run together unless that is your intent. For example:
Sample Report Generated on %[RunDate] at %[RunTime]
Default limit per report: 100
Represented with an arrow icon. Spacers are replaced by empty space of the specified height in pixels when the report runs. The space in the generated report will closely match what you see in a preview or screen display. Some variation is possible depending on the dominant settings of your output format. Note that adjacent elements will touch if you do not place a spacer between them.

A spacer between text and a table
Container (H) and Container (V) have separate default limits
Organize the layout of report pages in Report Building (Report Studio) with resizable containers that order their contents vertically or horizontally. These are components that can contain all other components, including other containers, making them a versatile tool in optimizing use of space.

Report components organized by two vertical containers (yellow) inside one horizontal container (blue).
Using Containers
Containers are accessible within the "Components" sidebar of Report Studio, denoted as "Container (V)" for a vertical-ordering container and "Container H" for horizontal. Drag and drop either onto the canvas to get started.
You may notice that a container first appears on the canvas as a tiny box. Note its blue color when you first drop it and its white color when you click outside of it. This visual aid indicates where the focus is. Be mindful of which container is in focus when deleting components. Deleting a container will also delete all components it holds.
When clicking and dragging any component in or around a container, blue ribbons will appear around it or any pre-existing components to indicate where the new one will be accepted.
You may drag and drop other components into a container and it will automatically resize to fit them. Containers can hold as many components as you would like but will only order them vertically or horizontally (Think of them as mini canvases).
Spacers work with Containers. They can be placed between these components to customize buffer space. The Spacer symbol will reorient itself once it is in place, although their icon may not change as you drag and drop them.
Components can be removed from containers and placed elsewhere on the canvas, containers moved this way can do so without compromising the integrity of their contents.
Container Properties
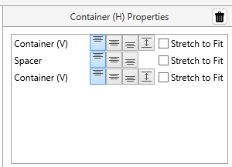
The horizontal container showcased above displays properties like this.
When a container is in focus, a corresponding properties menu will appear in the upper-right sidebar menu of Report Studio. Container properties may possess the following controls for placement of each component within the container's context:

|
Float Component Upwards |

|
Float Component towards the Middle |

|
Float Component towards the Bottom |

|
Fill Space Vertically, allowing the component to reach its maximum height (applies to Vertical Container Only). |

|
Stretch to Fit. Without exceeding the maximum height or width of the component, this will center it within the available space of a container along its primary axis. Multiple 'Stretch to Fit' components in the same container will share the space evenly, even across different screen sizes. |
Clicking a component's name in the container properties window will focus on the component instead and open up the component's properties.
These properties will default to 'Float Upwards' for the component if it is moved elsewhere within the canvas.
Alignment within the context of containers is only available along the vertical axis. To change horizontal alignment, view the individual component properties.
Rendering Containers in Different Formats
Container lines are not visible in the rendered report from Report Studio. Container use is translated in various ways across the available file types, as follows:
HTML
Container-organized layouts translate readily into HTML through the use of formatted <div> tags.
CSV
As a minimalist file type, CSV formatting will ignore line charts and complex images. It will translate container layouts into one vertical layout ordered left-to-right and by component depth within the containers (see tables numbered in orange below).

The table order in the report above translates to a vertical layout below in CSV formatting

Excel (.xlsx)
Container-organized layouts can be replicated consistently in Excel, with some tables undergoing resizing to accommodate all text sizes. Table cells are all translated into a uniform size, as determined by the largest text a cell is required to fit, so text in a smaller font may appear to be given more space than necessary.
Line chart data is accessible as a table on a separate sheet within the Excel file.
