Calculations & Operations Data Sets
The Report Studio is still under development and has not officially been released. Be warned that code may change such that reports you create with this pre-release trial version might need to be updated in order to continue working after your next VTScada update.
Until the official release, documentation for the Report Studio will open in response to the F1 key but will not be shown in the menu system. To view a table of contents for the complete chapter, navigate to Report Building (Report Studio)
The Report Studio Calculations data set will perform operations using:
- values from other data sets in your report
- numeric constants
- parameters that you have added to your report
There are three categories of calculation, consolidation, summarization and basic operations. As you build a calculation, the properties panel will add and enable additional fields.
Before you configure a Calculation data set, you must configure any data sets or parameters that will be used as a data source. After data sets and parameters are added to your report, they become selectable options in your Calculations data cell properties.
Calculation data sets are intended for use with a table component.
About Operations
What are these categories and what do they do?
→ Consolidation →
Consolidation is a means to combine multiple columns into a single column. This works on a per row (→) basis.
Think of a Tag Query data set that returns 4 tags. It displays four columns, one per tag. Each Consolidation-type calculation adds an additional column with a value consolidated from those 4 values.
There are several consolidation types:
- Total - The sum of all the values in the row
- Minimum - The lowest of all the values in the row
- Maximum - The highest of all the values in the row
- Average - All the values in the row added together and divided by the number of values.
- Median - The middle value of all the values sorted by size.
- Range - The highest value minus the smallest value in the row.
- Standard Deviation - How much the values of the set deviate from the average.
- Count - Counts how many columns with valid entries are in the set.
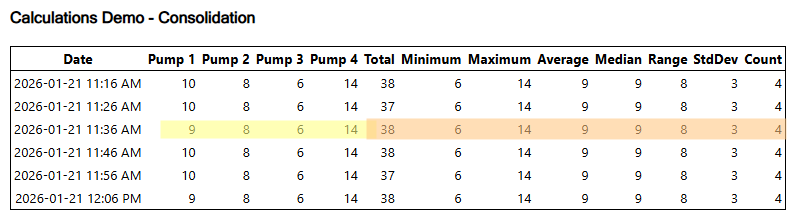
This example includes one of each of the available consolidation types. A row of equipment values from a Tag Query are highlighted in yellow. Because I added 8 calculations, there are eight additional columns displaying values calculated from the four pump values of the same row.
↓ Summarization ↓
Summarization is a means to combine a column of data into a single value to display in additional columns. This operation works on a per column (↓) basis.
Think of a Tag Query data set that returns 4 tags. It displays four columns of data. Summarization takes all the values from a whole column and applies a calculation. The result is displayed in four columns (one output column per input column) with the value repeated for each cell .
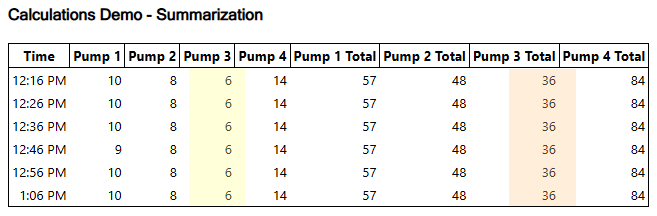
This example includes one summarization calculation. There are four additional columns. One column for each Tag Query value. The result of the calculation repeats in every row of the column.
Generally, a summarization calculation data set is used as input to another calculation.
You can display it in a report (as in this example) but you may find a summary row more suitable for report display purposes.]
There are several summarization types:
- Total - The sum of all the values in the column
- Minimum - The lowest of all the values in the column
- Maximum - The highest of all the values in the column
- Average - All the values in the column added together and divided by the number of values.
- Median - The middle value of all the values sorted by size.
- Range - The highest value minus the smallest value in the column.
- Standard Deviation - How much the values of the set deviate from the average.
- Count - Counts how many rows (with valid entries) are in the column.
Basic Operations
Simple mathematic expressions. For example, use a calculation data set to add a column to show a percentage or a unit conversion.
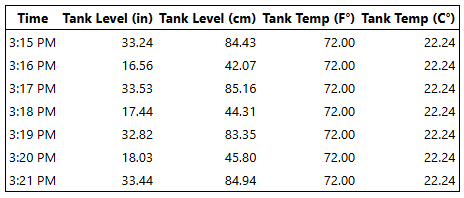
In this report, calculation data sets are used to convert imperial values to metric.
Possible operations include:
- Add - Add a value with another value ( + )
- Subtract - Subtract a value with another value ( - )
- Multiply - Multiple a value with another value ( * )
- Divide - Divide a value by another value ( / )
- Modulus - Divide one value with another and return the remainder. ( % )
- Exponent - Raise the first value to the power of the second. ( Pow )
Setup for Calculation configuration
Calculation drop lists are populated with data sets and parameters that are already configured in your report. It is recommended that you start with the other columns to be displayed in your report, data sets that query values to be used in your calculations, and add parameters if you want to include parameterized calculations in your report.
Create a Data Set
In the Data Set Manager, click [ + ] , select the correct Type from the drop list and give your Data Set a name. You may cultivate a selection of Data Sets in a single report configuration so you should opt for a descriptive name.
Click OK and the Data Set Properties will open on the right-hand side.
If you navigate away and want to get back to this properties panel, click on the Data Set in the manager.
Calculation Data Cell Properties

|
Step A appears by default. In the display example, Step B (Summarize) and Step C (Add) have been added for demonstration purposes. The Available Data Field, Step A has been selected to show formatting options. Delete the Data Set The trash can located in the header of a Data Set Properties panel will delete the Data Set. If you delete a Data Set that is being used by components or other Data Sets, they will stop working until you revisit their properties and select a suitable replacement. Before deleting, double check the header: Are you deleting a Data Set? Or a Data Cell? Name The name of your Data Set is displayed in this field. To change the name, edit the field. Step (Consolidate or Summarize) Operation - A drop list for specifying consolidate, summarize, or a basic math operation. If you choose "consolidate" or "summarize" the next two fields will be "Data" and either "Consolidation" or "Summary". As a quick reminder, consolidate works on a per row basis, and summarize works on a per column basis. Data - A drop list of options populated by the Data Fields configured in other Data Sets within the report. As you add additional steps, the results of previous steps also become available as options. Consolidation/Summary - Select the type. Total, Minimum, Maximum, Average, Median, Range, Standard Deviation, Count. |

Step (Basic Operations)
Operation - Basic math operations include add, subtract, multiply, divide, modulus and exponent.
Selecting a math operation changes the latter two fields:
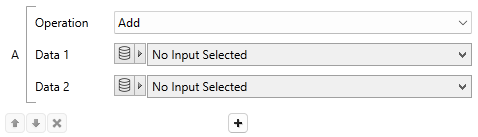
This configuration gives us Step A = Data 1 + Data 2.
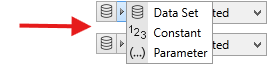
Data 1/Data 2 - Change the input type by clicking the arrow next to the disc icon. Choose from Data Set, Constant or Parameter.
Click the plus button [ + ] under the step to add another step. Use the arrow buttons to change the order of the Steps. As you add additional steps, former step results become available as Data options. In Step C, for example, in the Data Set type droplist, you would see the available Data Sets and also Step A, Step B as options. The result of Step C will not be available to Step A.
Configure Available Data Fields
Each selected data field will appear as a column in a report table. Changing the order of the steps by using the arrows beneath will change the order of the columns in the table. [x] to remove steps from the list is disabled for this Data Set type.
You cannot move a step above a step that references it. If you have steps A, B, C, D and use the result of B as an input in C, you will not be able to move C above B.
Parameterized Calculation Data Set Variables
Click the blue and white icon next to a "Header" field to open a parameterized phrase maker. The following variables are available to select:
| Operation | Consolidate, Summarize or the math operation selected for this step. |
| OperationType | Only for Consolidate or Summarize, the data type (for example, Average, Totalize, Starts) |
| Data1SourceHeader | The header generated from the first source of data in the step. Invalid if the data source is a report parameter or a constant. |
| Data2SourceHeader | The header generated from the second source of data in the step. Only basic math operations have a second data source. Invalid if the data source is a report parameter or a constant. |
Summary Suppression
Summary Suppression is used when you have added a summary row to the table but the value doesn't make sense for this data set. For example, summing daily high temperature is not a helpful metric.
Another example of where you might use summary suppression is a pump report that includes a data column for flow characteristics, and a column for pump run time. The first Data Set might be summarized with a Range. The second might be summarized with a total. In this case, you would add two summary rows to your report and suppress them in the opposing data sets.
Create Calculations with many steps
Calculations data sets will perform operations in order starting from Step A. You can create Calculations with many steps. For example, create a Calculation data set to convert units. In this example, we have an I/O and Calculations tag that reads the temperature in imperial units and we want to convert to metric units for a report.
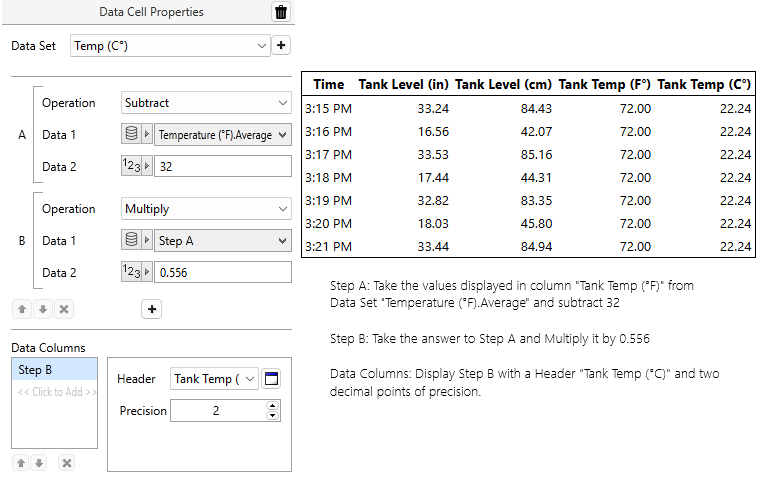
With this Data Set configured, the result of Step B will also become available as an input option in other Calculation Data Sets.
Combining Operation and Data types
Let's say you have a report of the flow activity for a couple of pumps and you'd like to add an extra column displaying their combined output as a percentage of flow capacity.
The output might look something like this:
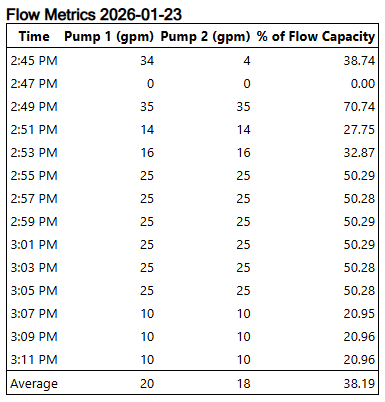
You have already configured:
- The title from a text component
- A formatted table component, with a configured Time per Record
- A Time column, showing the time of each entry.
- Using a Create Tag Queries, you've included both pumps in your report.
- The flow capacity is adjustable, so you've added and linked a tag-type parameter.
- A summary row to show averages.
All you have left to do, is add an additional column and add and configure a Calculation data set.
Here is a complete example:
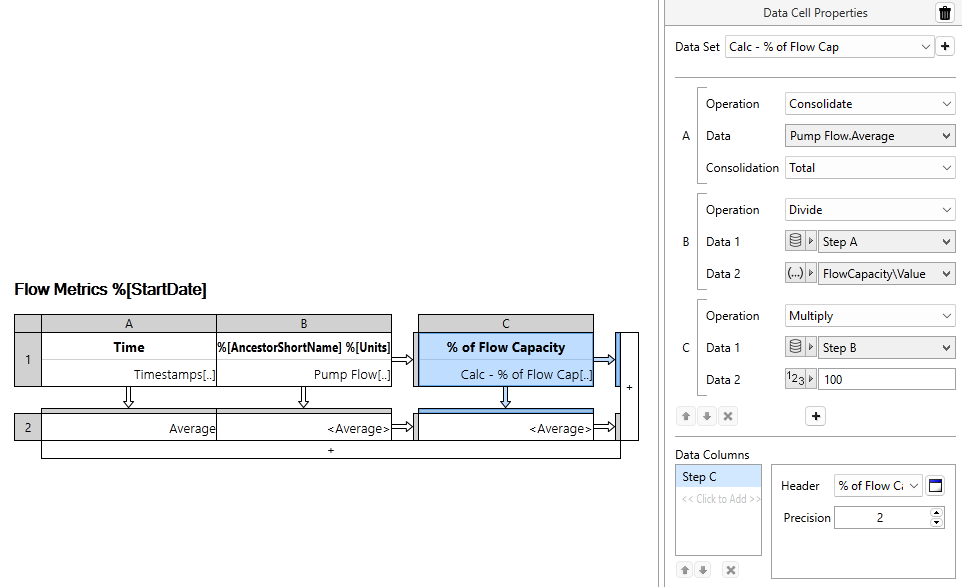
Step A
For the first step, we want to get the total per row. The Operation for Step A is Consolidate. The previously configured Tag Query data set "Pump Flow.Average" is available in the Data droplist, and the Consolidation type will be "Total".
Step B
Next we want to determine what fraction of flow capacity was taken up at each time entry. This is a basic math operation, Divide. Data 1 is a Data Set type so we can select the result of the first step, and that is divided by whatever value is stored in our parameter "FlowCapacity".
Step C
Finally, to display the fraction as a percent, we need to multiply it by 100. Step C is another basic math operation, Multiply. Data 1 is a Data Set type so we can select the result of Step B and Data 2 is a Constant type with the numeric entry, "100".
Available Data Fields
We don't want to display Step A or Step B in my report, so we have used the [ x ] button under Data Columns to remove those Steps. With Step C highlighted, we can configure the header and increase the precision to show decimal places.
Special notes about using Calculations in a report table
When a Calculations data set is added to a report table, the data cell properties will display the available data columns of the data set. Modifying the available data columns is disabled while "Use data set defaults" is enabled.
With "Use data set defaults" disabled, you can select each Data Column in turn and change the column format settings in the instance of this specific data cell without modifying the parent data set. This includes changing the header, precision and summary suppression. You can also change the column order and add or remove columns.
If you require a variation on the actual calculation, the best practice is to create a new data set. Clone the original, give it a distinct name and configure your variations within the new data set.
