Create and Manage Data Sets
The Report Studio is still under development and has not officially been released. Be warned that code may change such that reports you create with this pre-release trial version might need to be updated in order to continue working after your next VTScada update.
Until the official release, documentation for the Report Studio will open in response to the F1 key but will not be shown in the menu system. To view a table of contents for the complete chapter, navigate to Report Building (Report Studio)
Data Sets define the content in your reports by linking components to sources of data. Data Sets will appear in the Data Set Manager of a report. To get started with a report, add one or more Data Sets linked to the tags that will be featured in your report.
Some components will auto-generate Data Sets. For example, if you drag a table onto the canvas, a Timestamps Data Set will appear in your Data Sets manager.

When a Data Set is selected in the manager, its configurable properties will open in the properties panel. Click on a Data Set in the manager at any time to adjust the default properties.
From left to right, the buttons at the bottom of the Data Set Manager are used to create new, copy or delete a selected Data Set.
You may have just a couple of Data Sets, or amass a collection in your favorite report template to clone for quick variations or prepare for flexible ad hoc reporting.
The default maximum number of Data Sets that can be saved to a report is 30.
While the source of your report values is defined in Data Sets, the time period of a report and the Time Per Record are configured elsewhere.
Create a Data Set
In the Data Set Manager, click [ + ] , select the correct Type from the drop list and give your Data Set a name. You may cultivate a selection of Data Sets in a single report configuration so you should opt for a descriptive name.
Click OK and the Data Set Properties will open on the right-hand side.
If you navigate away and want to get back to this properties panel, click on the Data Set in the manager.
Data Set Types
Time
A "Timestamps" time Data Set is created automatically when a table is added to a report. The Time Data Set manages timestamps in a report. Use the Data Set to configure the header and time format.
Row Labels
A "Row Labels" Data Set is created automatically when a table is added to a report. This Data Set is for Pivot tables. Instead of values over time, Pivot tables show values from similarly grouped devices against their parent tags (Like several stations that all have pumps). The column that typically displays timestamps will need to display Row Labels instead (Station 1, Station 2...)
Tag Query
The Tag Query Data Set contains a tag selector. Filter and select tags manually or enter a tag query to include all of the tags that match your query criteria. This Data Set can be used in a table and a line chart. Set the default Data Fields and Summary Suppression.
Recipe Batches
The Recipe Batches Data Set is specifically for Recipe Book tags.
Use this type of report to create your own version of a Recipe Batch Report
Alarm and Events
Any alarm or event property can be shown in a report. Filters that you assign to the Data Set will define which alarms or events are included.
Transaction
Link this Data Set to a Transaction Logger tag to retrieve values from Transaction Logger tags and their child tags.
Calculations
Perform multi-step operations on values from other data sets, parameters or constants.
Notes
Include notes from selected Notebook tags. Include parent notes only or whole thread. Filter by contents and operator by text or parameter. Limit the number of notes and choose whether or not to include comments with your filter settings.
Universal Properties of Data Sets
There are a few settings that follow the same basic principles or function in every Data Set that they appear in:
Delete the Data Set
The trash can located in the header of a Data Set Properties panel will delete the Data Set. If you delete a Data Set that is being used by components or other Data Sets, they will stop working until you revisit their properties and select a suitable replacement.
Before deleting, double check the header: Are you deleting a Data Set? Or a Data Cell?
Name
The name of your Data Set is displayed in this field. To change the name, edit the field.
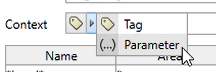
Context [Always Optional]
Context can be used in two ways:
- As a filter, limiting tag selection to those below a parent tag such as a station.
- As a parameter, allowing the same report to be run for multiple contexts or stations.
To use Context as a parameter, you must first create a parameter. Refer to Report ParametersNote that a value must be assigned to the parameter for use in the Report Studio before you can continue with further steps. Proceed to tag selection as usual. When operators run the report, they will be prompted to select a station or other parent tag to use for that instance of the report. Use Report Tags to predefine a choice for the parameter.
Selecting Tags
Most, but not all, Data Sets include a tag selector. The tag selector is a VTScada staple and functions the same way throughout. For an in-depth description, see: Tag Selector Dialog
Here are some quick tips for using the tag selector in Report Studio:
- Narrow down your options by using filters. You can use queries to filter by name or description. Queries take wildcards.
- Add tags: When you spot a tag you want to include, click it to turn it blue and then click "Select Tag".
- Add queries: Type a query into the name or description field and then click "Add Query." This will add the query to the selected table and that will include all tags qualified by the query.
- Take the following query for example: Filter by Name: *Station 1\Pump ?\Flow*.
This will include every tag (within Context) whose name includes "Station 1\Pump ?\Flow" where the ? may equal any character. Assuming a standard tag hierarchy, this report will include flow values from every pump child of Station 1.
Available Data Fields
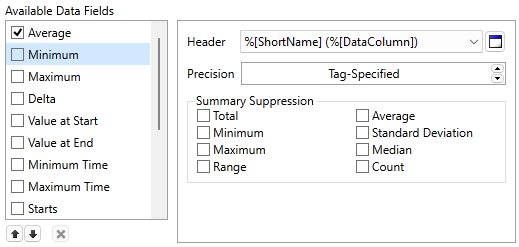
The selected data fields are directly related to the columns that appear in a table, by cell, or the lines that appear in a chart. The data fields that are available depends on the selected Data Set-- or more accurately-- it depends on the data that is actually available from the source of the query.
You have a Tag Query Data Set querying four IO tags monitoring flow, "Pump 1" to "Pump 4". You're using a table component to represent this data in a report. Cell A1 keeps the timestamps default, cell A2 has selected the Tag Query Data Set with "Average" as the lone Available Data Field.
Aside from your timestamps, your table will have four columns, "Pump 1 (Average) | Pump 2 (Average) | Pump 3 (Average) | Pump 4 (Average)".
If you also select the Available Data Field "Minimum", aside from your timestamps your table will have eight columns.
The arrows at the bottom will rearrange the column order, and the x can remove choices from the list when that option is available. If there are more options available, or to re-add removed options, <<Click Here to Add>>will appear at the bottom of the list. Click to open a droplist.
The Available Data Fields represent calculated values. That is to say, the average that appears for a single timestamp is the average of all values that were read during the period of time starting at that timestamp and ending prior to the next time stamp.
Common column formatting settings:
Header
The label representing the data field, appearing at the top of the column. Click the button on the right to open a parameterized phrase dialog. Combine string characters and parameter tokens to create headers that are context-sensitive.
Precision
Available for numeric entries. Select how many decimal places to display. Tag-Specified (default) will use the IO tag's configured precision.
Format
Available for timestamps. Use the parameterized phrase dialog to chose a date and time format.
Summary Suppression
Summary Suppression is used when you have added a summary row to the table but the value doesn't make sense for this data set. For example, summing daily high temperature is not a helpful metric.
Another example of where you might use summary suppression is a pump report that includes a data column for flow characteristics, and a column for pump run time. The first Data Set might be summarized with a Range. The second might be summarized with a total. In this case, you would add two summary rows to your report and suppress them in the opposing data sets.
Maximum Records [Always Optional]
Available in some Data Sets. Set a maximum record limit for entries that appear within a report.
Using Custom Parameters in Data Sets
Some fields accept custom parameters, like so:
Parameterized reports can be reused for similar purposes with slight variations. For example, if your application has several stations and you would like to produce the same report for each station, then you can use a parameter.
If you intend to use parameters in your report, add them to your report before configuring your Data Sets.
See Report Parameters for an in-depth explanation.
Create Reports for Recipe & Batch Management
Create Transaction Logger Reports
