
A VTScada Water & Wastewater Case Study for St. Johns County, Florida
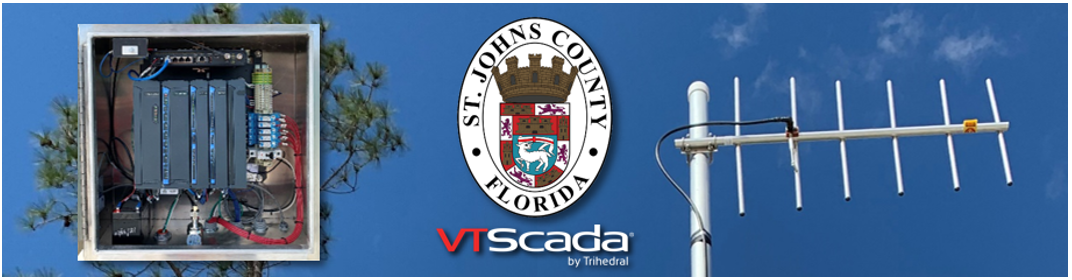
Named for the river that makes up its western border, St. Johns County, Florida, is home to over 250 thousand residents spread across various bedroom communities for the nearby City of Jacksonville. Since 2008, St. Johns County Utilities has been successfully using VTScada software by Trihedral for their water and wastewater instrumentation control systems. In recent years, SCADA Department Manager, Rick Nelson, noticed a trend. “There had been a history of us coming in in the morning or getting calls in the middle of night to learn that we had a communications failure at a lift station or at a water plant. When we would investigate, we’d find that there had actually been problems happening for a long time that we really wish we had caught sooner.” In this interview Rick Nelson and Senior SCADA Tech, Randy Howell, discuss how they worked with integrator Star Controls to upgrade their existing SCADA application to include new 4RF Radio network health monitoring pages that could pull alarm data from these devices. Once deployed, this page allowed them to immediately spot emerging radio problems before they could cause downtime in their mission critical system.
Chris Little – Thanks for joining us. Can you tell us about St. Johns County Utilities and the work you do there?
Rick Nelson -The St. Johns County SCADA Department maintains the instrumentation control systems for all the water/wastewater lift stations and booster stations for the county, which stretches over 800 square miles. Additionally, we aid operational staff in maintaining the systems, diagnosing equipment and instrumentation failures, and in the maintenance of the communications networks. I’m the department manager, I started this department by myself and was able to bring individuals in and now we are a department of five people.
Randy Howell -I come from an integrator background where I was responsible for submittals, design, panel builds, programming, testing, and debugging. I also handled documentation which is something I try to maintain here. We didn’t have a lot of that when I first came aboard. Helping to bring that under the same blanket has been a big help for the County, I think. As a technician, I kind of do the development, the debugging, and a little bit of the advanced troubleshooting.
Chris – What about your instrumentation control system?
Randy -The county has had VTScada since 2008. They originally had a contractor that ran an OEM version of the system at that time. In 2012, the County began to realize they were going to continue growing and they wanted to bring that all in house. Since then, we’ve maintained a handful of integrators who are experienced in using Motorola and VTScada. We utilize them as additional resources for larger projects and technical support when we need it. Currently, we’re implementing standards, for example we’ve recently been working on conforming our alarm management to ISA 18.2. We’re also gearing towards the high performance and situational awareness schemes with our HMI screens.
Chris – How many sites does this system include?
Rick – As far as lift stations and plants and boosters? Approximately 300.
Chris -Can you tell us about the hardware?
Rick -We’re a Motorola shop, for the most part. We had a majority of Motorola MOSCAD when I started here in 2012. Motorola Ace PLCs are what we’re slowly migrating to as we upgrade our legacy sites.
Chris – Recently, you upgraded the system to bring in alarm data from your 4RF digital radio network. What were your goals for that?
Rick – As an old Motorola field tech rep I’ve always realized that radio is one of the most important parts of a SCADA system. If you don’t have good reliable radio communications between your remote sites and your servers, the system is not going to be very helpful.
I’ve always known that most digital radios produced today can send out alarms and interact with various kinds of software. My goal was to be able to bring this all into one package. We love to use VTScada, it’s our favorite software, and I wanted to find a way to build a page that monitored our 4RF radio alarms. We asked Star Controls if this was something that they were interested in helping us to develop. They absolutely were and we immediately got them a task order. Within about a month, we had a working page.
Almost immediately, it started showing us, through trends, that there were site failures that we didn’t even know we were having. We could see that we had some high reflected power or some dipping signal to noise ratios on some radios that we weren’t aware of.
We were able to get out to these sites and find that sure enough, we had water in a coax where an antenna failure was allowing water in. Even though the site was still communicating relatively reliably, it was on the path to a catastrophic failure in the very near future. We were able to prevent that failure by being proactive. That’s really what this page has allowed us to do. It works really well.
Chris – So Randy, would you show us this new screen so we could see how it works?
Randy – This is the overview for all the sites that are under this master (below). We currently have one of the Masters online with 60 remote sites that talk to that radio. The screen is laid out with the site names in that far left column. On the right of that, in terms of signal strength and data, you’ve got two perspectives, from the master to the remote, that’s the next two columns, and from the remote to the master, that’s the fourth and fifth. Then there is all the data from the remote site itself. The internal temperature of the remote radio, the transmit and receive duty cycle of that radio. The RxRP alarm is an internal alarm to the radios, just like a general status. If there’s an alarm within the radio, that’ll send an alarm to VTScada that we can monitor. Then on the far right, we have the reflected power, which is one of the key indicators for an ongoing issue with the radio.
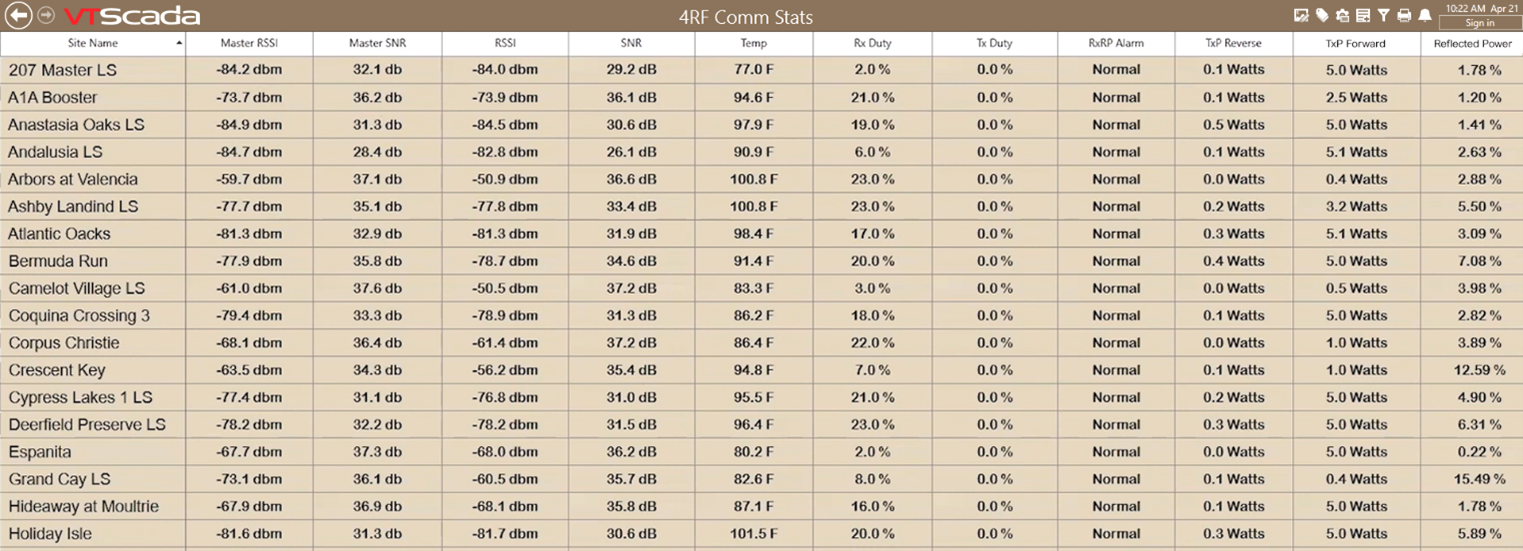
Rick – That’s measured in percent. We have the one column that shows the transmit forward power. Some radios are closer to the master than others, so we don’t necessarily need to use the full power. The transmit reverse power is how much reflected power is coming from the antenna. That tells us a whole lot about how that antenna is radiating the signal.
When you start pushing 10% reflected power, you can see here that a couple are exceeding the 10% threshold a little bit. Those are sites that are all working well at the moment, but we intend to get out there and run a return loss on that antenna. In some cases, it’s as simple as some tree branches that have grown in front of the antenna. In other instances, its a matter of some simple tuning of the antenna. We have a couple of versions of antennas that we can tune a little more to the center frequency of the radio we’re at. In most cases, what we’ve been finding is that some of the antenna manufacturers we’ve used are a little more susceptible to water intrusion than others. We’ve finally found a manufacturer that doesn’t really have that issue. Every one of these have been some antennas that have invariably had a little water intrusion and the coax.
Chris – You mentioned trending before, can you show us an example of how you would trend these values?
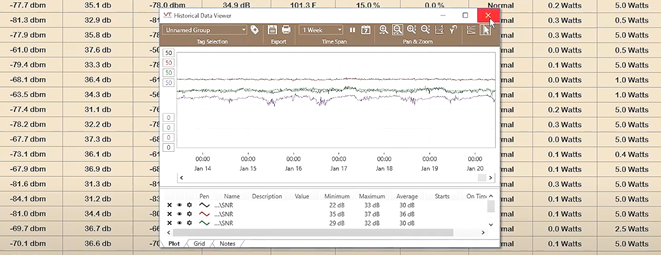
Randy -You can bring up the data in the HDV where you can set it for whatever timeframe you want. You can click on as many different values as you want to add them to the trend. We have the polling rate set to every 15 minutes so it’s not overloading the rest of our system.
If you’ve got water in your coax or if there’s an issue with the antenna, you can see the level slowly degrade over time. Right now, a lot of those levels are kind of holding where they are, which is what you want to see. This gives us the ability to look at that signal over time and gauge what’s going on with those antennas.
Randy: I think one of the neat things is being able to look at the temperature throughout the day.
Rick – This is the internal temperature of the radio. It’s not the actual temperature inside the cabinet but it does give us an indication of whether there’s some sort of a problem in the cabinet or in the radio.
Chris – So, once you create that trend, I assume you’re able to export that data to a spreadsheet to work with later, is that right?
Randy – We just use the onboard tools that VTScada has available in the Historical Data Viewer for that.
Rick -The 4RF radios we use have their own rudimentary way of trending that only lets us look at the previous 24 hours but it’s nowhere near as detailed as what we can do with VTScada. This is a really good tool to help us if say, we have a heavy rainy day and we start seeing the trend go downwards for things like reflective power or the signal to noise ratio. The signal to noise ratio can also be an indicator of other RF interference, be it atmospheric or somebody else putting a signal in on your system. So, this helps us to troubleshoot that.
Randy – There are a couple of other neat features on the screen. You can organize the columns alphabetically or numerically. On the reflected power you’d be able to see which sites are performing worse than others. You can identify which ones are above whatever threshold you want to set.
Another item is when your values go within certain ranges. We asked Star Controls to develop it to where it would change colors based off the alarm values or the threshold that we set. So, we can identify it and kind of give that situational awareness. So, when you first look at it, you see the ones that really stand out. We had different ranges with different colors.
Rick – We set a bottom threshold for the signal to noise ratio to change colors below 23 db. We don’t like to see our signal noise ratios go below 26, anybody who’s a radio guy, like me, will understand, especially with digital radios, that when you start getting below 26, that that’s when the error rate starts increasing. We set our threshold at 23. Those are the sites that are the real problems.
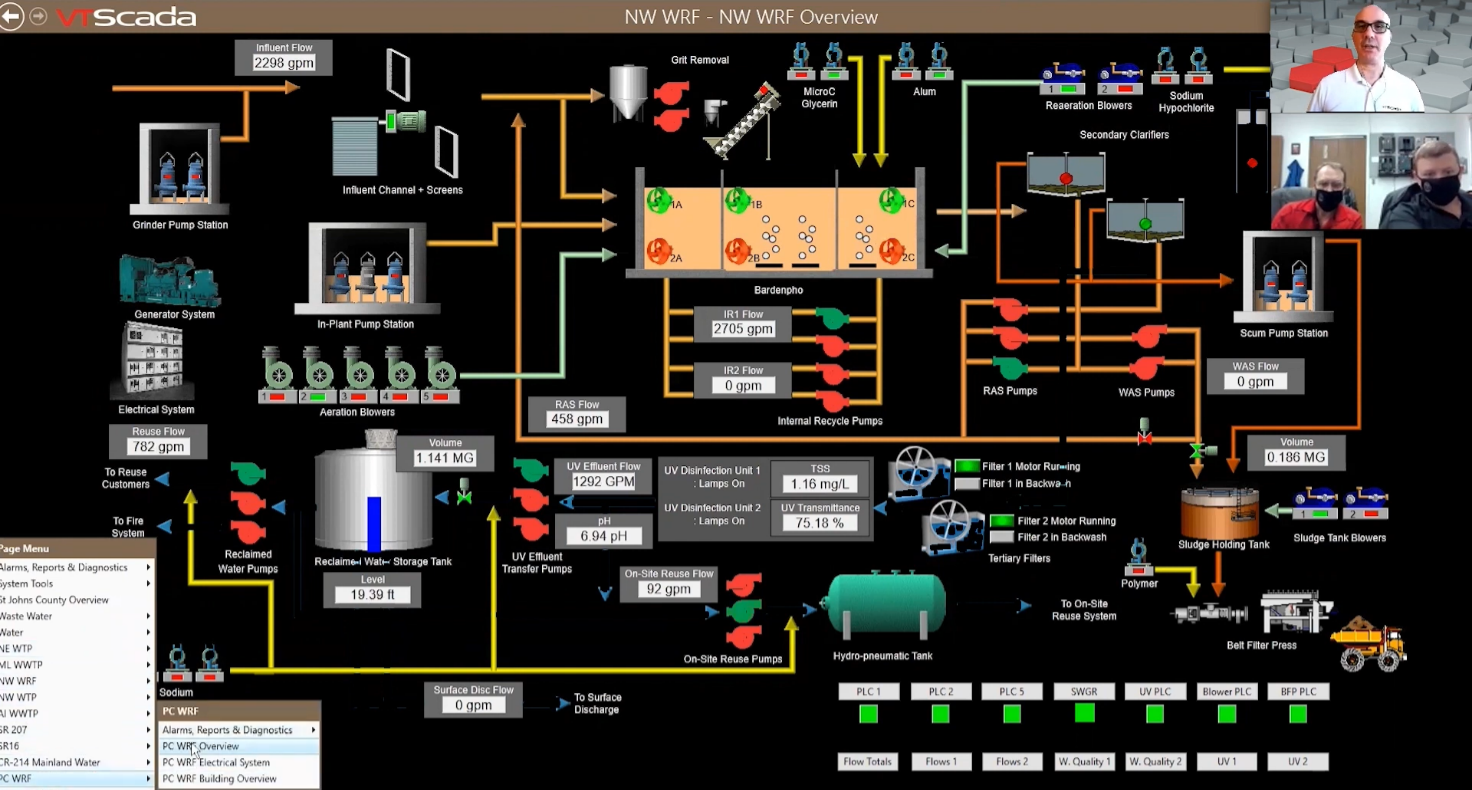
Randy – Additionally, we use our system for all the local water and wastewater facilities that we have. Like we said, we have about 300 remote sites with upwards of around 240 lift stations. They’re running standalone SCADA applications at each of those sites. We’re also running [a redundant node for all these] applications on one machine. We utilize VTScada’s Master & Subordinate feature to monitor all of them through the one Master application.
We have our overview for the Northeast Water Plant, or you can jump to one of the wastewater plants. You can also access all the sub pages that are children to those applications through the same root application.
Chris – What’s the advantage of a master application that reads from subordinate applications, as opposed to having them all be one big application?
Randy -For me, its simplicity. It’s less work for the County. We only have to contract to do the work one time, rather than having a local application and then an enterprise application in separate areas to see it in multiple areas. It’s all done in one spot and you’re able to see it anywhere.
Rick – It helps to save money. We don’t have to pay a vendor to do the same thing twice, once out at our remote HMI, and then all the way out at our office. Its a long drive to get to this part of the County. This way, they can just make the upgrade, save it and its automatically downloaded to the servers. This tool has really been awesome for us.
Chris – Obviously, you’re on a roll now what’s next?
Randy – I’d like to conform all the remote sites and the standalone applications to more of the high performance screen layout. In terms of the 4RF upgrade, we have seven total master towers. The 4RF data we’re bringing in now is only from one master with 60 sites on it. We currently have just over 200 digital radios out in the field. We want to bring all of those into the system as well so we can monitor and maintain and perform the preventative maintenance we need to keep that system integrity in place as well as upgrading our legacy equipment.
Chris Little – Thanks so much for joining us. We really appreciate having you here.
For More Information
Rick Nelson, SCADA Department Manager, St. Johns County Utilities, rnelson@sjcfl.us
Chris Little, Media Relations, VTScada by Trihedral, chris.little@trihedral.com
Try VTScada for Free
VTScadaLIGHT is the free version of Trihedral’s award winning SCADA software, perfect for small industrial and personal applications with up to 50 I/O. Pros and hobbyists alike will love its built-in features and easy learning curve. Watch the Quick Start Tutorial to get up and running in minutes. When you need more than 50 I/O, its easy. www.vtscada.com/free-scada-software/
Images used with kind permission of St. Johns County Utilities