
Standard Component
VTScada includes a variety of troubleshooting and debugging tools that our programmers and support staff to spot performance bottlenecks, diagnose issues, and gather diagnostics.
In general, the diagnostic utilities are useful to:
- Programmers when writing VTScada script code.
- Customers when directed to use a tool by VTScada support staff, to diagnose a problem.
These tools are designed to be functional, rather than user-friendly. Most utilities are not listed in the VAM by default but can be added using the Find Existing option of the Add Application Wizard.
Key diagnostic tools include:
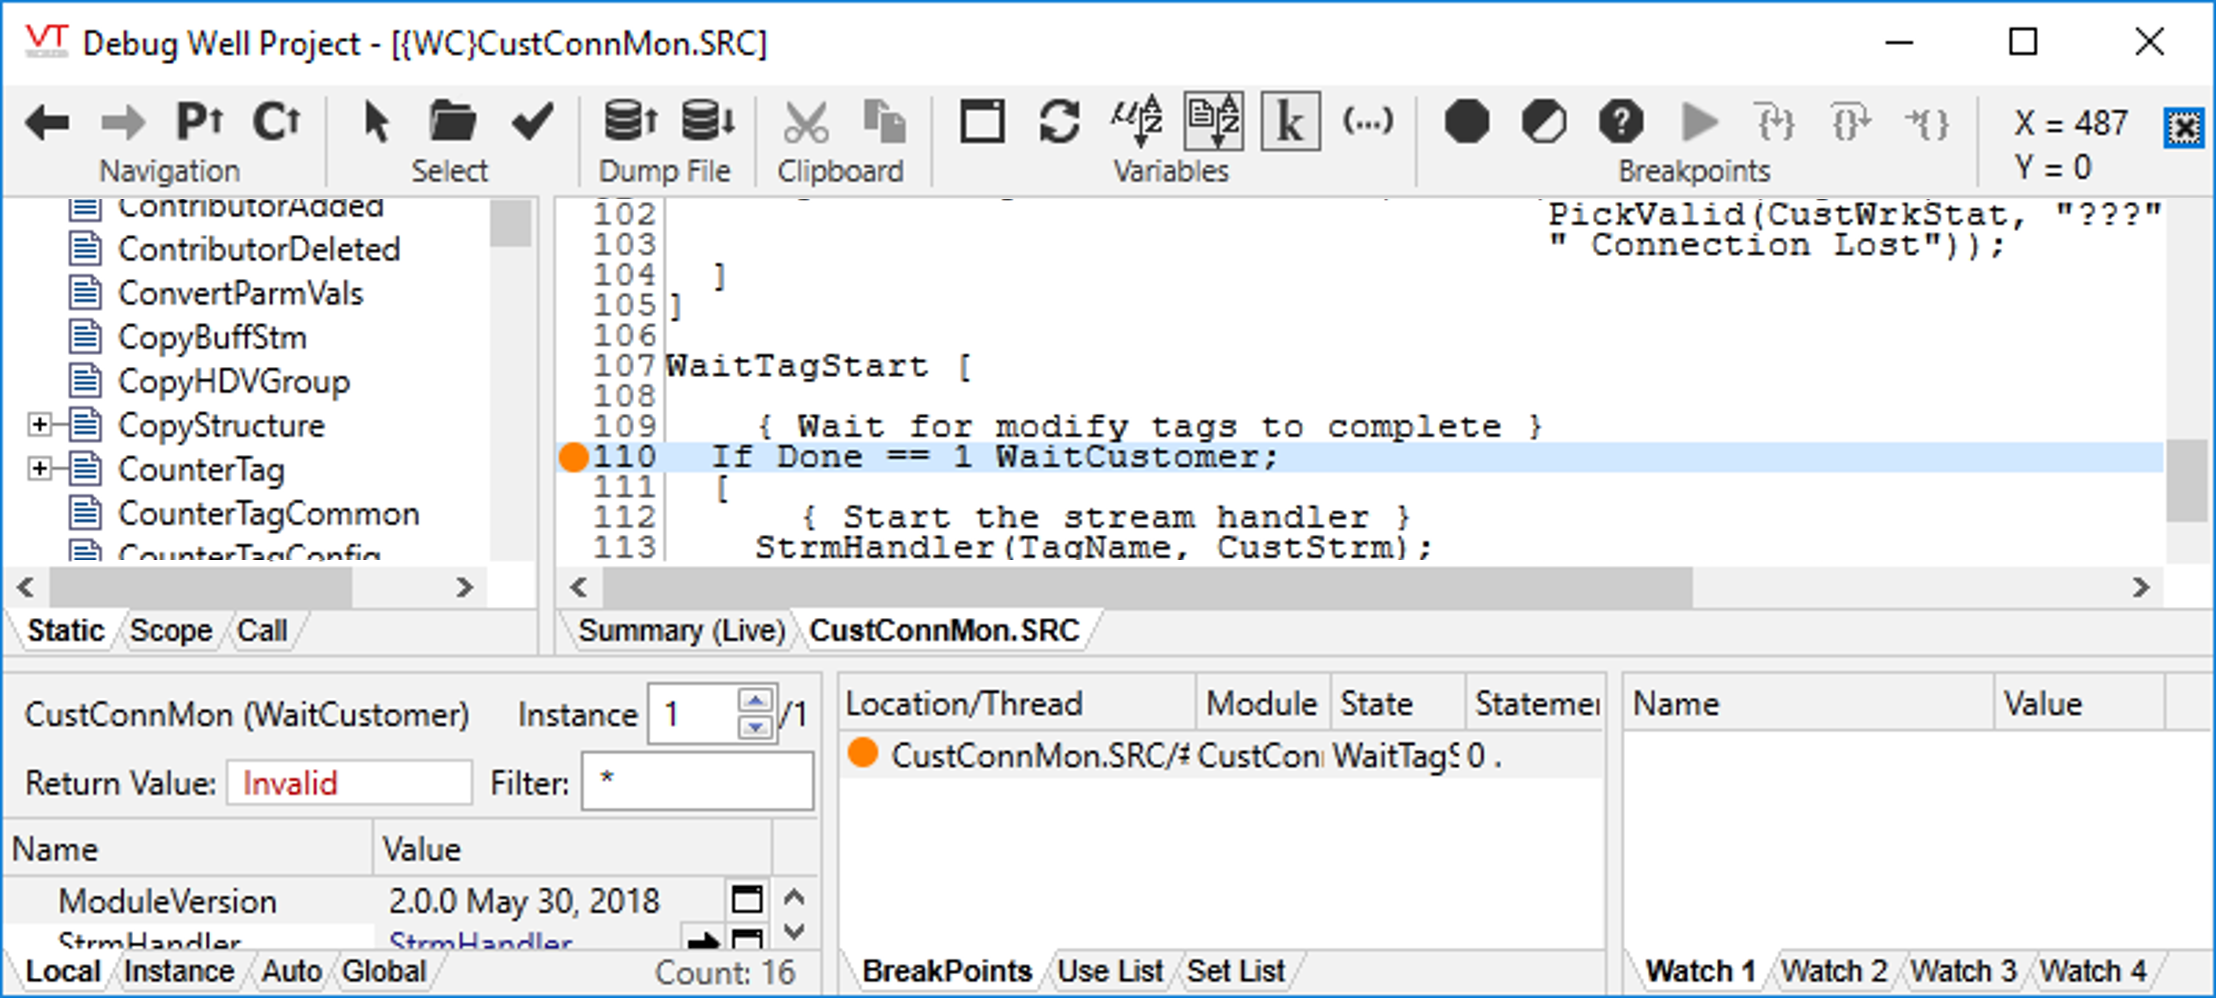
- Source Debugger: A versatile tool for diagnosing performance issues and debugging code.
- Trace Viewer: Monitors inter-server communications, device driver communication, or SOAP messages.
- Memory Tracer Application: Traces high memory usage to specific modules.
- RPC Timing Utility: Monitors the time required by server-to-server messages.
- Instance Count Application: Counts instances of all modules in all running applications.
- Driver Diagnostic Tools: Includes subroutines for monitoring and logging driver communications..